
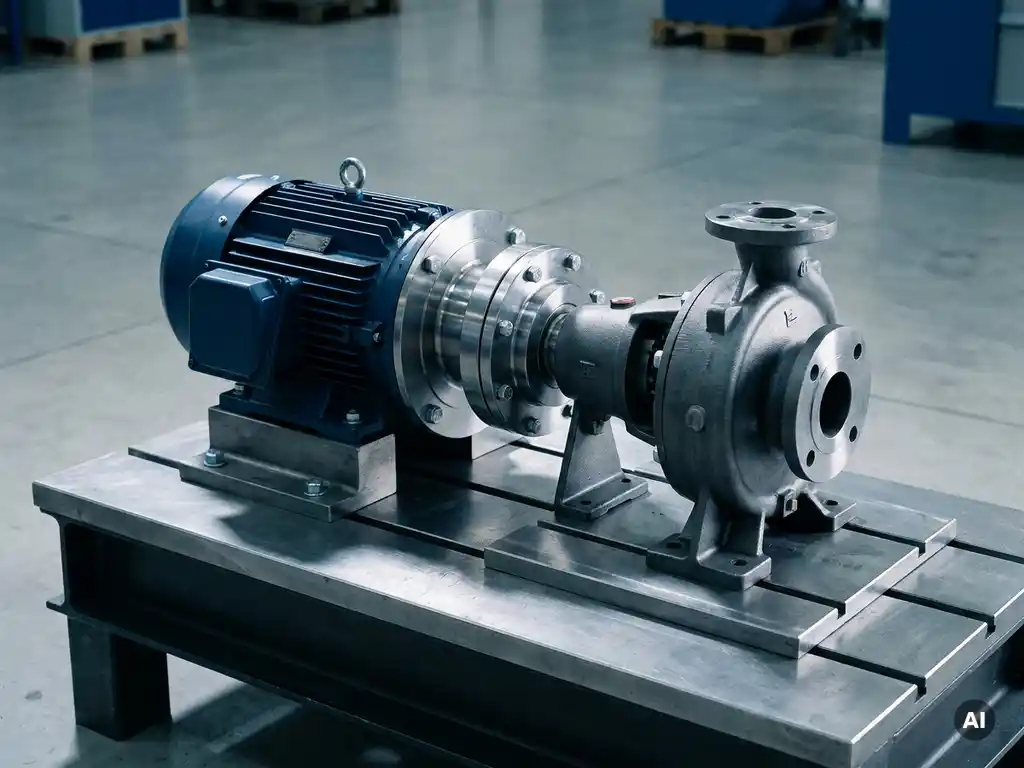
Overall Equipment Effectiveness (OEE) is calculated by multiplying three factors: Availability, Performance, and Quality. The formula is OEE = Availability x Performance x Quality. Each factor is expressed as a percentage, and the result reveals how effectively a piece of equipment is being used relative to its full productive potential.
OEE is widely used in manufacturing and industrial operations as a benchmark for identifying losses and prioritizing improvement efforts. A score of 100% represents perfect production: running all planned time, at full speed, with zero defects. In practice, most facilities sit well below that mark, which is precisely where the framework becomes useful.
The sections below answer the most common questions about OEE calculation, what each factor measures, what drives scores down, and how manufacturers can improve across all three dimensions.
How is OEE calculated from its three factors?
OEE is calculated using the formula: OEE = Availability x Performance x Quality. Each factor is expressed as a decimal (for example, 90% becomes 0.90), and the three are multiplied together. A facility running at 90% availability, 85% performance, and 95% quality would achieve an OEE of approximately 72.7%, which is below the commonly cited world-class benchmark of around 85%.
The multiplicative structure of the formula is intentional and important. Because the three factors are multiplied rather than averaged, weakness in any single area has a compounding effect on the overall score. A facility with excellent availability and quality but poor performance will still produce a mediocre OEE result. This design forces organizations to look at all three dimensions simultaneously rather than optimizing one at the expense of others.
The OEE formula is grounded in the concept of planned production time. All three factors are measured against what the equipment was scheduled to do, not its theoretical maximum. This makes OEE a practical operational metric rather than a theoretical one, directly tied to the production schedule and business expectations.
What does availability mean in OEE?
Availability in OEE measures the percentage of planned production time during which equipment is actually running. It is calculated as: Availability = Run Time / Planned Production Time. Run time is planned production time minus any stops, whether planned (such as changeovers) or unplanned (such as breakdowns). A machine scheduled to run for eight hours but stopped for one hour has an availability of 87.5%.
Availability captures what the OEE framework calls availability losses, which fall into two categories:
- Unplanned stops: Equipment breakdowns, unexpected failures, and emergency maintenance interventions that halt production without warning.
- Planned stops: Scheduled activities that take equipment offline, including changeovers, setups, and planned maintenance windows.
Of the two, unplanned stops tend to have a more damaging effect on overall operations because they are unpredictable. A sudden breakdown disrupts production schedules, requires reactive maintenance, and often triggers secondary problems in connected systems. Planned stops, by contrast, can be scheduled during low-demand periods and managed more efficiently.
In asset-intensive industries, availability is often the factor with the greatest room for improvement and the highest potential payback. Even a modest improvement in uptime, such as reducing unplanned stoppages by a few hours per week, can translate directly into meaningful production gains and cost reductions.
What does performance mean in OEE?
Performance in OEE measures how fast equipment runs during its available run time compared to its designed maximum speed. The formula is: Performance = (Ideal Cycle Time x Total Count) / Run Time. It answers the question: when the equipment was running, was it running at full speed? A machine capable of producing 100 units per hour but averaging only 80 units per hour has a performance rate of 80%.
Performance losses are grouped into two types:
- Small stops: Brief interruptions, typically under five minutes, that do not get logged as formal downtime but still reduce output. Examples include jams, sensor faults, and operator interventions.
- Slow cycles: The equipment runs continuously but at a speed below its rated capacity, often due to worn components, suboptimal settings, or operator caution around unstable machinery.
Performance losses are frequently the hardest to detect because the equipment appears to be running. A machine that is technically operational but cycling at 75% of its rated speed will not trigger an alarm, yet it consistently erodes output and inflates unit costs. Capturing these losses requires accurate cycle time data and real-time monitoring rather than simple uptime tracking.
Vibration is a common but underappreciated driver of performance losses in rotating equipment. When drivetrain components introduce instability, operators often reduce operating speeds as a precaution, quietly degrading performance OEE without any formal downtime event being recorded.
What does quality mean in OEE?
Quality in OEE measures the proportion of total output that meets specification on the first pass, without requiring rework or being scrapped. The formula is: Quality = Good Count / Total Count. A production run that yields 950 acceptable units from 1,000 total units produced has a quality rate of 95%. The 50 rejected or reworked units represent lost productive capacity even though the machine was running.
Quality losses fall into two categories:
- Production rejects: Parts or products produced during steady-state operation that fail to meet quality standards and must be scrapped or reworked.
- Startup rejects: Defective output produced during startup, after changeovers, or following maintenance interventions, before the process reaches stable operating conditions.
Quality losses are particularly costly because they represent wasted material, energy, and machine time. Every defective unit consumed resources during production but generated no usable output. In industries with expensive raw materials or tight tolerances, even a small reduction in the quality rate can have a significant financial impact.
Process instability is a frequent root cause of quality losses. Equipment running with excessive vibration, thermal variation, or inconsistent speed is more likely to produce out-of-specification output. Addressing the mechanical stability of rotating equipment is therefore not just a maintenance issue but a quality issue as well.
What causes a low OEE score in industrial equipment?
A low OEE score in industrial equipment is most commonly caused by unplanned downtime, speed losses from mechanical degradation, and process instability that generates defects. These three root causes map directly onto the three OEE factors and often interact with each other, meaning a single underlying problem can simultaneously suppress availability, performance, and quality.
In rotating equipment specifically, several recurring failure patterns drive OEE losses:
- Misalignment: Industry sources consistently identify misalignment as a leading cause of rotating machinery failures. Misaligned shafts introduce uneven bearing loads, accelerate seal wear, generate vibration, and eventually cause breakdowns that eliminate availability entirely.
- Wear in mechanical couplings: Traditional couplings with elastomers, lubricants, and contact surfaces degrade over time. As they wear, they introduce torsional irregularities and vibration that reduce performance and shorten the service life of connected components.
- Unplanned maintenance interventions: Every reactive repair requires lockout/tagout procedures, disassembly, realignment, and recommissioning. Each step introduces human error risk and consumes planned production time.
- Overcapacity operation: Running pumps and fans at full speed when partial load would suffice wastes energy and accelerates component wear without improving output quality.
- Vibration propagating through the drivetrain: Vibration that originates in a coupling or motor can travel through bearings, seals, and gearboxes, degrading multiple components simultaneously and compressing the time between failures.
The compounding nature of OEE means that a facility dealing with frequent misalignment-related failures may be losing availability to breakdowns, performance to cautious speed reductions, and quality to process instability, all at the same time. Addressing the mechanical root cause rather than each symptom separately is the most efficient path to a higher OEE score.
How can manufacturers improve OEE across all three factors?
Manufacturers improve OEE by systematically targeting the root causes of losses in each of the three factors: reducing unplanned downtime to improve availability, eliminating speed losses to improve performance, and stabilizing processes to improve quality. The most durable improvements come from changes that address mechanical root causes rather than relying solely on operator behavior or procedural controls.
Improving availability through reliability engineering
The most effective strategy for improving availability is reducing the frequency and duration of unplanned stops. This means moving from reactive maintenance toward condition-based or predictive maintenance approaches. Monitoring key indicators such as vibration levels, temperature, and bearing condition allows maintenance teams to intervene before a failure occurs rather than after.
Eliminating design-level failure mechanisms is even more powerful than improving maintenance response. Equipment that does not wear, does not require periodic realignment, and does not degrade predictably generates fewer breakdown events by design. Extended mean time between failures translates directly into higher availability without requiring any change in maintenance staffing or procedures.
Improving performance by eliminating drivetrain instability
Performance losses caused by slow cycles and small stops are often traceable to mechanical instability in the drivetrain. Reducing vibration, eliminating torsional oscillations, and ensuring smooth torque transmission allows equipment to run consistently at its rated speed without operator intervention.
For variable-load applications such as pumps and fans, matching output to actual demand rather than running at fixed full speed is a well-established method for improving energy efficiency without sacrificing throughput. Systems designed to modulate speed in response to process demand eliminate the overcapacity losses that inflate energy costs and accelerate wear.
Improving quality through process stability
Quality improvements in manufacturing are closely linked to process stability. Consistent speed, smooth torque delivery, and low vibration all contribute to more predictable output. Reducing the number of startup cycles, changeovers, and maintenance interventions also reduces the frequency of startup rejects, since each restart represents a period of unstable operation before steady-state conditions are reestablished.
How Zytec Non-Contact Drives Support OEE Improvement
Zytec's non-contact magnetic drives directly address the mechanical root causes that suppress all three OEE factors in rotating equipment. By eliminating physical contact between the motor and driven equipment, Zytec drives remove the wear mechanisms, misalignment sensitivity, and vibration propagation that are among the most common drivers of availability losses, performance degradation, and process instability in industrial facilities.
Concrete ways Zytec technology supports higher OEE include:
- Availability: No wear components, no lubrication, and no laser alignment requirements mean fewer scheduled and unscheduled maintenance interventions. The F-TORQ coupling is rated for a maintenance-free operational span of over 20 years, structurally reducing the breakdown events that eliminate run time.
- Performance: The non-contact operating principle eliminates torsional oscillations and vibration transmission through the drivetrain, allowing equipment to run consistently at rated speed. The A-TORQ drive enables speed modulation for pumps and fans, matching output to demand and eliminating the overcapacity losses that inflate energy use and component wear.
- Quality: Smoother, more stable torque delivery reduces process variation, lowering the rate of defects and out-of-specification output caused by drivetrain instability.
- Total cost of ownership: With energy savings of up to 50% and maintenance cost reductions of up to 50%, the payback period for Zytec installations is often under two years.
If your facility is dealing with chronic availability losses, unexplained performance gaps, or quality variation linked to rotating equipment, contact Zytec to explore how non-contact magnetic drive technology can deliver measurable OEE improvement in your specific application.
Frequently Asked Questions
What is considered a 'good' OEE score, and how does my facility compare to world-class benchmarks?
A score of 85% is widely cited as the world-class benchmark for OEE, but context matters significantly. Many well-run facilities operate effectively in the 60–75% range, and even moving from 50% to 65% can represent substantial production gains. Rather than fixating on a universal target, the more actionable approach is to establish your current baseline, identify which of the three factors is dragging your score down most, and set incremental improvement goals tied to specific loss categories.
How do I get started measuring OEE if my facility doesn't currently track it?
Start by focusing on a single critical piece of equipment rather than trying to roll out OEE measurement facility-wide. Collect three data points for that machine over a defined period: total planned production time, actual run time, output count, and the number of good parts produced. Even manual data collection using shift logs and operator records is enough to calculate a baseline OEE and identify your biggest loss category. Once you've validated the approach on one asset, you can expand to additional equipment and consider automated data collection tools.
What's the difference between OEE and TEEP, and when should I use each?
OEE measures equipment effectiveness against planned production time, while Total Effective Equipment Performance (TEEP) measures it against all available calendar time, including unscheduled and off-shift hours. OEE is the right metric for day-to-day operational improvement because it reflects what your team can realistically control during scheduled production. TEEP is more useful for strategic capacity planning decisions, such as evaluating whether to add a shift, invest in additional equipment, or renegotiate production schedules to meet growing demand.
How do I identify whether availability, performance, or quality is my biggest OEE problem?
Calculate each factor separately before multiplying them together and look for the lowest individual score — that's your primary constraint. If availability is below 80%, focus on downtime reduction and maintenance strategy first. If availability is strong but performance lags, investigate slow cycles and small stops using real-time monitoring or cycle time analysis. If both availability and performance are healthy but quality is low, prioritize process stability, startup conditions, and root cause analysis on defect patterns. Tackling the weakest factor first delivers the fastest OEE gains.
Can OEE be applied to an entire production line, or is it only meaningful for individual machines?
OEE can technically be calculated at the line or plant level, but it's most actionable when applied to individual assets or bottleneck equipment. Aggregating OEE across a line can mask which specific machine is causing losses, making it harder to prioritize corrective action. A common best practice is to calculate OEE at the equipment level for diagnostic purposes and then report a line-level or plant-level figure for management visibility — using the granular data to drive improvement and the aggregate number to track overall progress.
What are the most common mistakes manufacturers make when implementing OEE tracking for the first time?
The most frequent mistake is treating OEE as a reporting metric rather than an improvement tool — tracking the number without acting on the loss data it reveals. A second common error is inconsistent categorization of downtime events, which makes trend analysis unreliable over time. Finally, many facilities undercount performance losses because slow cycles and small stops are invisible without real-time monitoring, leading them to overestimate their true OEE and misallocate improvement resources toward availability when performance is actually the bigger drag.
How does predictive maintenance connect to OEE improvement, and where should I start?
Predictive maintenance improves OEE primarily through the availability factor by reducing the frequency and duration of unplanned breakdowns. The practical starting point is vibration monitoring on rotating equipment, since vibration signatures often provide early warning of bearing wear, misalignment, and imbalance weeks or months before a failure occurs. Pairing vibration data with temperature monitoring and oil analysis gives maintenance teams enough lead time to schedule repairs during planned downtime windows rather than reacting to emergency failures — directly converting unplanned stops into planned ones and recovering lost run time.