
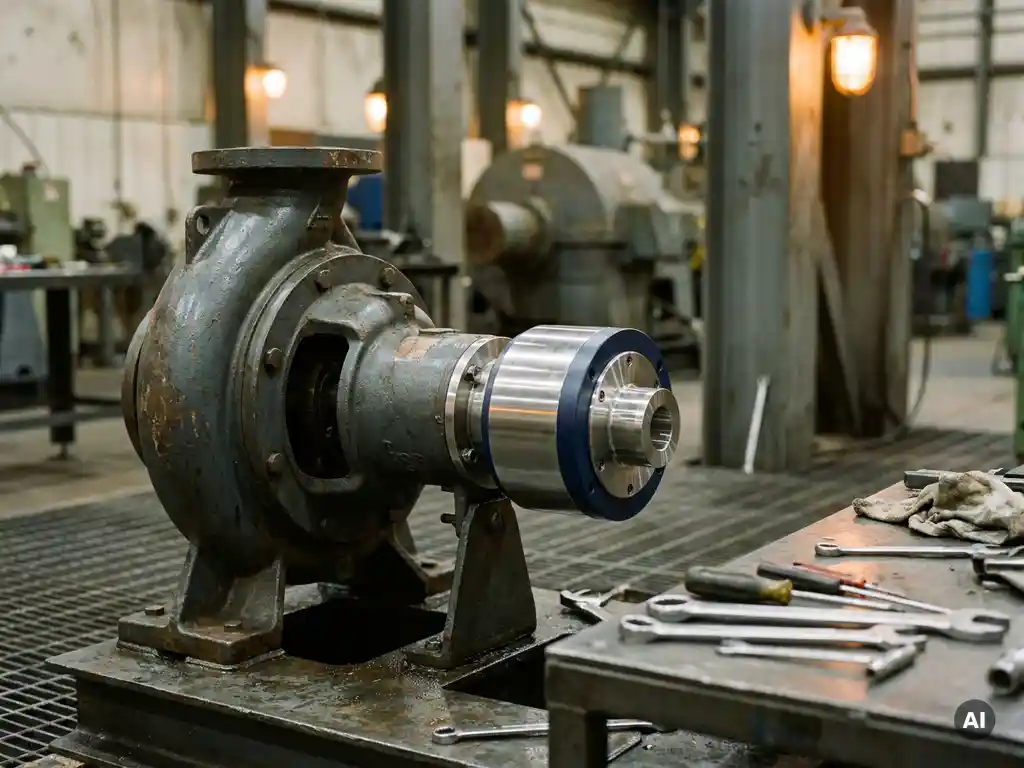
Map every cost driver across the pump lifecycle
Start by building a complete picture of where money is actually leaving the business. Most pump cost analyses stop at purchase price and scheduled maintenance intervals, which means the largest cost categories go unmanaged. A proper pump lifecycle cost assessment covers every expenditure from installation to decommissioning.
Gather data from your CMMS, energy monitoring systems, procurement records, and production logs. You are looking for the following cost categories:
- Energy costs: Electricity consumption at actual operating load, not nameplate rating. For most centrifugal pumps running at partial load, this is the dominant cost over the asset's life.
- Maintenance labor: Scheduled and corrective work orders, including preparation time, lockout/tagout administration, permit-to-work processing, and post-maintenance recommissioning.
- Spare parts and consumables: Seals, bearings, couplings, lubricants, and alignment consumables. Track what gets replaced and how often.
- Downtime costs: Lost production value, contractor call-out fees, and expedited parts procurement during unplanned stoppages.
- Indirect costs: Alignment-induced bearing and seal failures, vibration-related structural damage, and the engineering time spent investigating recurring failures.
Once you have populated each category with real figures, calculate the annual spend per pump and rank your assets by total cost. This ranking tells you where to focus improvement efforts first. A pump that costs little to buy but consumes disproportionate maintenance and energy resources is a priority target regardless of its age.
Eliminate overcapacity to cut energy consumption
Overcapacity is one of the most overlooked sources of wasted energy in pump systems. Many pumps are sized for peak demand scenarios that rarely occur in practice, meaning they run at full speed continuously while the process only requires a fraction of that output. The result is excessive energy draw, throttling losses through control valves, and accelerated wear on mechanical components.
Identify overcapacity in your pump systems using these steps:
- Compare the pump's operating point (actual flow and head) against its design point on the pump curve. A significant gap between the two indicates overcapacity.
- Review how flow is currently controlled. If throttle valves or bypass loops are in use, the pump is almost certainly running above process demand.
- Calculate the theoretical shaft power required at actual operating conditions using the affinity laws. For centrifugal pumps, shaft power follows a cubic relationship with speed: halving the rotational speed reduces power demand to one-eighth of its original value.
- Quantify the energy savings available by matching pump speed to actual process demand rather than running at full speed with artificial restriction.
Variable speed control is the standard solution for eliminating overcapacity. When you match pump speed to real process demand, pump energy savings of up to 50% are achievable in systems that previously relied on throttling. Verify your baseline and post-improvement energy consumption using power meters at the motor terminals, not estimated figures from nameplate data, since real-world operating efficiency often differs significantly from catalog values.
Reduce mechanical wear to lower maintenance spend
Mechanical wear in pump drivetrains generates a disproportionate share of total maintenance spend. Bearings, seals, and couplings are the primary wear points, and their failure rates are strongly influenced by the quality of power transmission between the motor and the pump. Misalignment is cited in industry sources as responsible for roughly 30 to 50% of rotating machinery failures, making it one of the most significant controllable cost drivers in any pump maintenance program.
Address mechanical wear systematically by working through the drivetrain from motor to pump:
- Audit alignment quality. Check shaft alignment on your highest-cost pumps using laser alignment equipment. Record both angular and parallel offset values, and compare them against the coupling manufacturer's tolerance limits. Many installations that appear aligned at installation drift significantly during operation due to thermal expansion, pipe strain, and foundation movement.
- Eliminate torsional shock. Evaluate whether your coupling type transmits torque peaks and torsional vibration into the pump shaft. Rigid and semi-rigid couplings pass these forces directly into bearings and seals, accelerating wear. Flexible couplings attenuate some shock but still require periodic element replacement and realignment.
- Extend bearing and seal intervals. With alignment corrected and shock loads reduced, recalculate expected bearing L10 life at actual operating loads. A drivetrain operating under stable, well-aligned conditions will typically achieve bearing service lives two to four times longer than one subject to recurring misalignment and torsional peaks.
- Reduce maintenance intervention frequency. Every time a technician works on a rotating assembly, there is a measurable probability of reassembly error. Incorrect bolt torque, imperfect realignment, and missing fasteners are well-documented contributors to early failure after maintenance. Reducing the number of scheduled interventions structurally reduces this risk.
Track the results by comparing mean time between failures (MTBF) for bearings and seals before and after drivetrain improvements. A reduction in pump maintenance costs should become visible within the first 12 to 18 months as the improved operating conditions accumulate. If bearing and seal replacement intervals have not extended measurably after that period, revisit the alignment audit and check for pipe strain or foundation issues that may be reintroducing dynamic misalignment during operation.
Prevent unplanned downtime with proactive monitoring
Unplanned downtime is the most expensive failure mode in any pump system. Beyond the direct cost of emergency repairs, unplanned stoppages carry the cost of lost production, expedited parts logistics, contractor call-out premiums, and the downstream disruption to connected processes. Preventing these events requires moving from reactive to condition-based maintenance.
Set up a proactive monitoring program for your priority pumps using the following approach:
- Install vibration monitoring at bearing housings. Vibration amplitude and frequency signatures change predictably as bearings degrade. Establishing baseline vibration levels for each pump in good condition gives you a reference point for detecting deterioration early.
- Monitor motor current draw. Increases in current at constant speed and load often indicate mechanical resistance from deteriorating bearings, seal friction, or partial blockage. Motor current is easy to monitor continuously with existing instrumentation.
- Track seal leakage and temperature. Mechanical seal condition degrades progressively. Leakage rate and local temperature around the seal housing are reliable early indicators of approaching failure.
- Set alert thresholds and response protocols. Define the vibration, current, and temperature levels that trigger an inspection, and the levels that trigger a planned shutdown. The gap between these thresholds is your intervention window, the time available to schedule maintenance before failure occurs.
The goal of condition monitoring is to convert unplanned failures into planned interventions. A planned shutdown on your schedule, with parts on hand and a maintenance crew ready, costs a fraction of an emergency breakdown. Industry experience consistently shows that facilities with mature condition monitoring programs achieve significantly lower pump downtime costs than those relying on fixed-interval maintenance alone. Verify your program is working by tracking the ratio of planned to unplanned maintenance events over successive quarters.
Calculate and validate your TCO reduction over time
With improvements implemented across energy consumption, mechanical wear, and downtime prevention, the final step is to quantify the financial impact and validate it against your original lifecycle cost baseline. This is how you confirm that the investment in improvement has delivered real value, and how you build the business case for extending the same approach to additional assets.
- Recalculate annual cost per pump using the same categories you mapped in step one: energy, maintenance labor, spare parts, and downtime. Use actual post-improvement data, not estimates.
- Compare against your baseline. The difference between pre-improvement and post-improvement annual cost is your annual savings per asset. Multiply by the number of improved pumps to calculate total program value.
- Calculate payback period. Divide the total investment in improvements (equipment, installation, engineering) by the annual savings. For well-executed pump TCO programs, payback periods under two years are achievable, particularly where energy savings are significant.
- Project savings over the remaining asset life. A pump with 10 years of remaining service life that saves a meaningful amount per year delivers substantial cumulative value. This figure is what you present when making the case for further investment.
Validate your results by running the comparison over at least two full quarters to account for seasonal variation in energy prices and production throughput. If your energy savings are lower than projected, recheck whether the variable speed control is operating correctly across the full load range. If maintenance savings are lower than expected, review whether alignment quality has been maintained and whether condition monitoring alerts are being acted on within the defined response window.
How Zytec helps lower the total cost of ownership of a pump
Zytec's non-contact magnetic drives address the core cost drivers described in this guide directly and simultaneously. Where conventional couplings introduce misalignment forces, torsional shock, and scheduled replacement cycles, Zytec's technology eliminates all three by transmitting torque across a magnetic air gap with no physical contact. The practical consequences for pump TCO are concrete:
- Energy savings up to 50% through precise variable speed control that matches pump output to actual process demand, eliminating the overcapacity losses that throttle-controlled systems generate continuously.
- Maintenance costs reduced up to 50% by removing wear components, lubrication requirements, and laser alignment from the maintenance schedule entirely. The coupling's expected service life spans the full lifetime of the installation.
- Vibration reduced up to 80%, which directly extends bearing and seal service life and reduces the structural loading that drives unplanned failures in connected equipment.
- No alignment requirement during installation or operation, eliminating the largest single source of bearing and seal overload in conventional pump drivetrains.
- Payback periods typically under two years, making the investment financially straightforward to justify against any lifecycle cost baseline.
If you are ready to calculate what a non-contact drive could save on your specific pump applications, contact Zytec to request a TCO analysis for your installation.
Frequently Asked Questions
How do I know which pumps in my facility should be prioritized for a TCO reduction program?
Start by ranking your pumps by total annual cost using the categories outlined in the post: energy, maintenance labor, spare parts, and downtime. Any pump that appears disproportionately expensive relative to its purchase price or production contribution is a priority target. Pay particular attention to pumps that run continuously, use throttle valves for flow control, or have a recurring history of bearing and seal failures, as these three characteristics are the strongest indicators of high lifecycle cost and significant savings potential.
What if I don't have energy monitoring equipment installed — can I still estimate pump energy costs?
Yes, but treat estimates as a starting point rather than a reliable baseline. You can approximate energy consumption using the pump's nameplate motor rating, average operating hours, and local electricity tariffs, but nameplate figures typically overstate real-world efficiency by 10–20%. For any pump where energy is likely to be a dominant cost driver, investing in a temporary clamp-on power meter for a two- to four-week monitoring period will give you accurate actual consumption data and make your savings calculations defensible when presenting to management.
What are the most common mistakes organizations make when trying to reduce pump maintenance costs?
The most frequent mistake is treating maintenance reduction as a scheduling problem rather than an engineering one — reducing intervention frequency without first addressing the root causes of wear, such as misalignment, torsional shock, or overcapacity operation. This approach simply defers failures rather than preventing them. A second common error is relying on visual or manual alignment checks instead of laser alignment equipment, which routinely misses angular and parallel offsets that fall well within the visible range but still significantly reduce bearing and seal service life.
How difficult is it to retrofit variable speed control onto existing pump installations?
In most cases, adding a variable frequency drive (VFD) to an existing fixed-speed pump motor is a straightforward retrofit that does not require replacing the pump or motor. The main engineering considerations are verifying that the motor is inverter-duty rated or compatible, confirming that the pump curve is suitable for speed reduction at your actual operating range, and checking that minimum flow requirements are met at reduced speeds to prevent overheating or cavitation. For pumps currently controlled by throttle valves or bypass loops, the energy savings from a VFD retrofit typically deliver payback within one to two years.
At what point does it make more financial sense to replace a pump rather than continue optimizing it?
The crossover point is reached when the projected cost of continued improvements — including parts, labor, and downtime risk — exceeds the lifecycle value of a new, more efficient asset over the same remaining service period. A practical trigger is when a pump's hydraulic efficiency has degraded significantly from its original design point due to impeller wear, or when recurring failures are consuming maintenance resources that a modern pump would not require. Running a side-by-side TCO projection for the existing asset versus a replacement, using the same cost categories described in this post, gives you a financially grounded answer rather than one based on age alone.
How long does it typically take to see measurable results after implementing drivetrain and alignment improvements?
Energy savings are visible almost immediately after variable speed control is commissioned, since power consumption drops as soon as the pump stops running at full speed against a throttle valve. Maintenance savings take longer to materialize because they depend on extended component life — expect the first clear evidence in bearing and seal replacement intervals after 12 to 18 months of improved operating conditions. Downtime reduction becomes measurable within two to three quarters once condition monitoring baselines are established and the ratio of planned to unplanned maintenance events begins to shift.
Can condition monitoring be implemented cost-effectively on a large number of pumps, or is it only practical for critical assets?
Modern wireless vibration and temperature sensors have reduced the cost of condition monitoring significantly, making it practical to deploy across a broader asset population than was feasible with wired systems. A tiered approach is common and effective: invest in continuous online monitoring for your highest-criticality or highest-cost pumps, and use periodic manual readings with handheld instruments for secondary assets. Even a simple manual vibration and temperature route on a monthly schedule provides meaningful early warning compared to purely reactive maintenance, and the data collected over time helps you identify which secondary assets warrant an upgrade to continuous monitoring.