
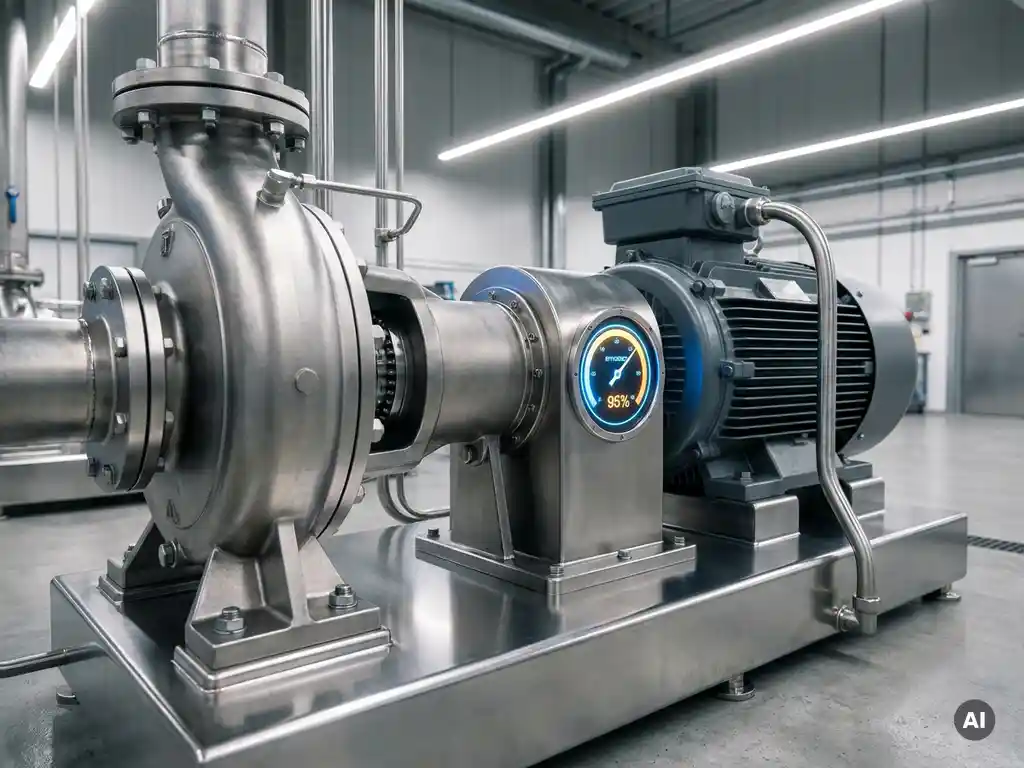
OEE, or Overall Equipment Effectiveness, is used effectively when it drives specific improvement actions rather than serving as a reporting metric. Calculate it regularly, trace losses to their root causes using the six big losses framework, and use the results to prioritize maintenance, scheduling, and process decisions. The sections below walk through everything you need to apply OEE with real impact on the shop floor.
What are the three components of OEE?
OEE is calculated by multiplying three performance factors: Availability, Performance, and Quality. Each component isolates a distinct category of loss, and together they produce a single percentage that reflects how effectively a piece of equipment is being used relative to its full potential. The OEE formula is: OEE = Availability x Performance x Quality.
Availability
Availability measures the proportion of planned production time during which the equipment is actually running. It accounts for losses caused by unplanned breakdowns and planned stops such as changeovers and maintenance. A machine that runs for 420 minutes out of a planned 480-minute shift has an Availability of 87.5%. Reducing downtime events directly improves this component.
Performance
Performance compares the actual output rate to the ideal or designed output rate during the time the machine is running. Slow cycles, minor stoppages, and operator-related delays all pull Performance below 100%. A machine running at 90% of its ideal speed scores 90% on Performance, even if it was available the entire shift. This component often reveals hidden capacity losses that go unnoticed without measurement.
Quality
Quality captures the proportion of output that meets specification on the first pass. Scrap, rework, and startup rejects all reduce the Quality score. A production run that yields 950 good parts out of 1,000 total parts achieves a Quality rate of 95%. Improving first-pass yield is frequently the fastest route to a higher overall OEE score in process-intensive environments.
What is a good OEE score in manufacturing?
A commonly cited benchmark for world-class OEE is 85%, based on Availability of 90%, Performance of 95%, and Quality of 99.9%. In practice, most manufacturing facilities operate between 40% and 60% OEE, meaning there is significant untapped capacity in the average industrial plant. What counts as "good" depends heavily on the industry, equipment type, and production model.
Discrete manufacturing environments with high-mix, low-volume production typically operate at lower OEE scores than dedicated, high-volume lines because changeover time weighs heavily on Availability. Process industries such as chemicals or pulp and paper often target higher Quality rates but accept more planned downtime for maintenance. Rather than chasing a universal benchmark, the most useful approach is to establish your own baseline and measure improvement against it over time.
OEE scores below 65% generally indicate systemic issues with equipment reliability, scheduling, or process control. Scores in the 65% to 75% range suggest room for meaningful improvement through focused maintenance and operator training. Scores above 85% are achievable but require sustained discipline across all three components simultaneously, which is why world-class status is the exception rather than the rule in most manufacturing settings.
How do you collect OEE data accurately?
Accurate OEE data collection requires defining clear measurement boundaries before recording anything. Specifically, you need a consistent definition of planned production time, a reliable method for logging downtime events and their causes, a way to capture actual output versus ideal output, and a quality inspection process that distinguishes first-pass good parts from rework and scrap.
Manual data collection using paper logs or operator-entered spreadsheets is the most common starting point and works reasonably well for single machines or small facilities. The main risk is inconsistency: different operators may classify the same stoppage differently, or forget to record short stops that individually seem minor but collectively drag down Performance. Standardizing downtime reason codes and training operators on how to apply them is the most important step in making manual collection reliable.
Automated data collection through machine sensors, PLCs, or dedicated OEE software eliminates most human recording errors and captures micro-stoppages that manual methods miss. Cycle counters, run-time signals, and quality inspection outputs can feed directly into an OEE dashboard in real time. The investment in automation pays off quickly in larger facilities where manual logging becomes a burden and where the accuracy of the data directly influences capital and maintenance decisions.
Regardless of method, the golden rule is to collect data at the machine level, not the line or plant level. Aggregated OEE figures obscure which specific equipment is responsible for losses, making it impossible to act on the results effectively.
What are the six big losses in OEE?
The six big losses are a framework developed alongside OEE to categorize every type of productivity loss that reduces equipment effectiveness. They map directly onto the three OEE components: two losses reduce Availability, two reduce Performance, and two reduce Quality.
- Breakdowns (Availability): Unplanned stops caused by equipment failure, including mechanical faults, electrical faults, and component wear. These are typically the most visible and costly losses.
- Setup and adjustments (Availability): Planned stops for changeovers, tooling changes, product transitions, and startup warm-up periods. Reducing changeover time through SMED techniques directly improves this loss category.
- Minor stoppages (Performance): Brief interruptions lasting a few seconds to a few minutes, such as jams, sensor triggers, or material feed issues. Individually small, these events accumulate significantly over a shift.
- Reduced speed (Performance): Equipment running below its designed or ideal cycle time due to operator caution, worn tooling, suboptimal settings, or process instability.
- Startup rejects (Quality): Defective output produced during the warm-up phase after a startup, changeover, or maintenance event, before the process reaches stable operating conditions.
- Production rejects (Quality): Defects produced during steady-state operation, including scrap and parts requiring rework.
Mapping losses to these six categories transforms OEE from a score into a diagnostic tool. Once you know which category is responsible for the largest share of lost effectiveness, you can apply the right countermeasure rather than guessing where to focus improvement effort.
How can OEE be used to reduce unplanned downtime?
OEE reduces unplanned downtime by making breakdown losses visible, quantifiable, and traceable to specific equipment and failure modes. When Availability drops, the OEE framework prompts you to ask why the machine stopped, how long it was down, and how often that failure type recurs. That structured inquiry is the foundation of effective maintenance planning.
The most direct application is using OEE trend data to identify equipment with deteriorating Availability before a catastrophic failure occurs. A machine whose Availability score gradually declines over several weeks is signaling increasing wear or a developing fault. Catching that trend early allows maintenance teams to intervene during planned windows rather than responding to emergency breakdowns during production hours.
OEE data also supports prioritization. In any facility with multiple assets, not all breakdowns carry the same cost. By combining OEE loss data with the production value of each machine, maintenance teams can rank assets by the financial impact of their downtime and allocate resources accordingly. This is the core logic of reliability-centered maintenance: focus effort where it produces the greatest return in uptime and output stability.
Reducing the mechanical root causes of downtime is equally important. Equipment that transmits vibration, operates under misalignment, or experiences frequent torque shocks accumulates wear faster and fails more often. Addressing those underlying conditions, rather than simply responding to symptoms, is what converts OEE from a measurement exercise into a genuine reliability improvement program.
What are the most common mistakes when implementing OEE?
The most common mistake in OEE implementation is treating it as a reporting metric rather than an improvement tool. When OEE scores are collected and displayed without triggering specific corrective actions, the measurement effort produces no operational benefit and quickly loses credibility with the teams responsible for generating the data.
Other frequent implementation errors include:
- Inconsistent definitions: Using different definitions of planned production time, ideal cycle time, or quality thresholds across shifts or machines makes OEE scores incomparable and misleading.
- Measuring at the wrong level: Calculating OEE at the line or plant level hides which specific assets are responsible for losses. Machine-level measurement is essential for actionable results.
- Ignoring the six big losses: Reporting a single OEE percentage without breaking it into loss categories tells you that performance is poor but not why or where to intervene.
- Setting targets before establishing a baseline: Imposing an OEE target of 85% on a facility currently running at 52% without understanding the loss structure creates pressure without direction.
- Neglecting operator engagement: OEE data is only as good as the people recording it. If operators do not understand why the data matters or do not trust that it will be used fairly, data quality deteriorates rapidly.
- Optimizing one component in isolation: Pushing Quality to 99.9% while ignoring a 60% Availability score produces a misleading overall figure and misses the dominant source of lost production.
Successful OEE programs share a common structure: clear definitions, consistent data collection, regular loss analysis at the machine level, and a direct link between OEE findings and maintenance or process improvement actions. Without that link, OEE remains a number on a dashboard rather than a driver of manufacturing efficiency.
How Zytec helps improve OEE in rotating equipment
For industrial facilities where pumps, fans, compressors, and other rotating equipment are central to production, a significant share of OEE losses originates in the drivetrain. Breakdowns caused by misalignment, coupling wear, and vibration-induced bearing failures directly reduce Availability. Reduced-speed operation caused by process instability or overcapacity pulls down Performance. Zytec's non-contact magnetic drives address these losses at their mechanical root cause.
- Availability improvement: Zytec's F-TORQ eliminates wear components, lubrication requirements, and alignment-induced bearing overload, removing the most common mechanical causes of unplanned downtime in rotating equipment. With a maintenance-free operational span exceeding 20 years, scheduled coupling interventions are removed from the maintenance calendar entirely.
- Performance improvement: The A-TORQ provides intelligent speed control for pumps and fans without the parasitic energy losses associated with variable frequency drives, allowing processes to run at optimized operating points rather than throttled or oversized configurations.
- Vibration reduction: By transmitting torque across an air gap without mechanical contact, Zytec drives reduce vibration by up to 80%, extending the service life of bearings, seals, and connected equipment and further extending the time between forced stops.
- TCO reduction: Fewer interventions, no alignment costs, no wear consumables, and lower energy consumption combine to reduce total cost of ownership by up to 50%, shortening payback periods to under two years in most applications.
If your OEE analysis points to rotating equipment as a primary source of Availability or Performance losses, contact Zytec to find out how non-contact magnetic drive technology can eliminate those losses at the source and deliver measurable, lasting improvements in overall equipment effectiveness.
Frequently Asked Questions
How often should we calculate and review OEE scores?
OEE should be calculated at the shift or daily level for operational decisions, and reviewed at a weekly or monthly level for trend analysis and improvement prioritization. Shift-level data lets supervisors respond quickly to emerging losses, while longer-term trends reveal whether improvement actions are producing lasting results. Avoid reviewing OEE only monthly — by the time a problem appears in monthly data, significant production capacity has already been lost.
What is the best way to get started with OEE if we have never measured it before?
Start with a single machine — ideally your most critical or most problematic asset — and focus on getting the definitions right before worrying about software or automation. Agree on what counts as planned production time, establish your ideal cycle time, and define how operators should classify downtime events using a short list of reason codes. Run manual data collection for four to six weeks to build a baseline, then use that baseline to identify your dominant loss category before expanding the program to other equipment.
Can OEE be applied to an entire production line rather than a single machine?
OEE can be calculated at the line level, but doing so as your primary metric is generally counterproductive. Line-level OEE is constrained by the weakest asset in the line, which means the score reflects that bottleneck without telling you which machine it is or why it is underperforming. The recommended approach is to calculate OEE at the machine level first, identify the constraint, and focus improvement effort there — then use line-level OEE as a secondary indicator to track the cumulative effect of those improvements.
What is the difference between OEE and TEEP, and when should we use TEEP instead?
OEE measures equipment effectiveness relative to planned production time, while TEEP (Total Effective Equipment Performance) measures it relative to all available calendar time — including unscheduled hours, weekends, and holidays. TEEP is useful when you are evaluating whether to add a shift, invest in additional capacity, or assess the true utilization of a capital asset. If your OEE is strong but your TEEP is very low, it may indicate that the equipment is underutilized overall, not just inefficient when running.
How do we set realistic OEE improvement targets without demoralizing the team?
Set targets based on your loss structure, not on industry benchmarks. Once you have broken your OEE score into the six big losses, identify the single largest loss category and estimate how much of it is realistically recoverable within a defined timeframe. A target of improving Availability from 72% to 80% by addressing the top two breakdown causes is far more motivating and actionable than a blanket directive to reach 85% OEE. Incremental, loss-specific targets build momentum and make the connection between team actions and measured results visible.
How do we handle OEE measurement for equipment that runs multiple products with different ideal cycle times?
When a machine runs multiple products, each with its own ideal cycle time, OEE must be calculated using the correct ideal cycle time for the product being produced during each measurement interval. The most practical approach is to maintain a product-specific cycle time table and link it to your data collection system so that Performance is always calculated against the right reference. Avoid using a single average cycle time across all products — this distorts Performance scores and makes it impossible to identify whether speed losses are product-specific or equipment-related.
What role does operator training play in sustaining OEE improvements over time?
Operator engagement is one of the most important and most underestimated factors in OEE sustainability. Operators are the primary source of manual data collection, the first to notice minor stoppages and speed losses, and often the people best positioned to identify the root causes of recurring issues. Investing in training that explains why OEE is measured, how the data is used, and how operator input directly influences maintenance and process decisions builds the trust and ownership needed to maintain data quality and sustain improvement gains beyond the initial implementation phase.