
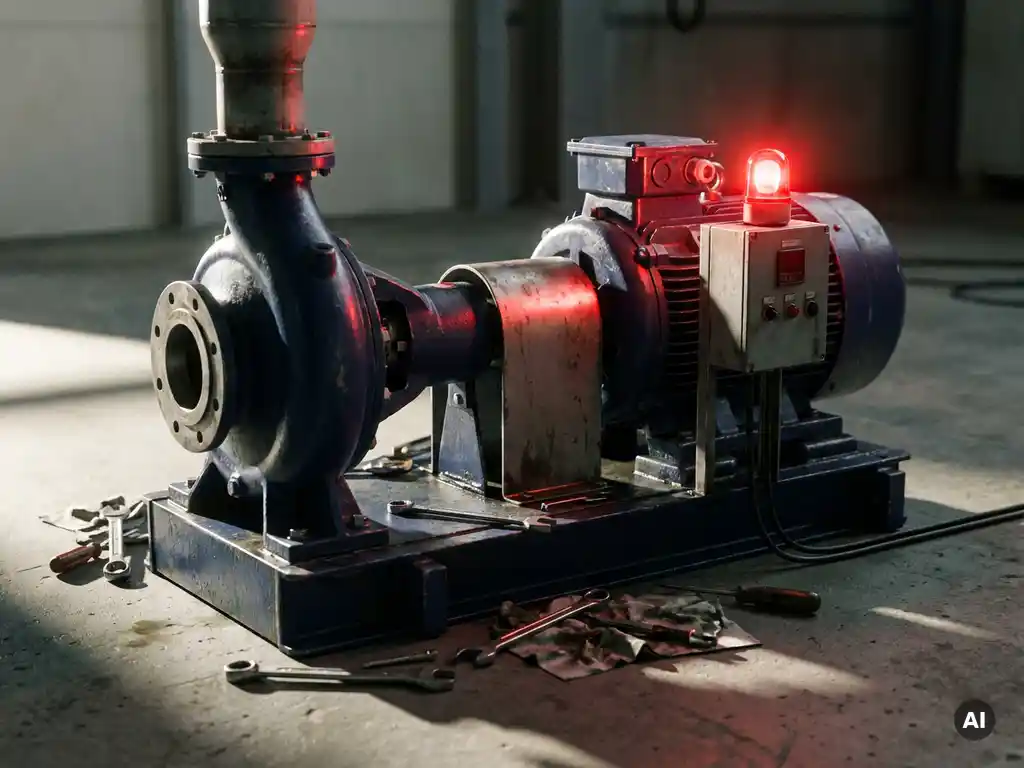
To calculate downtime in manufacturing, subtract the actual production time from the planned production time for a given period. The result is the total downtime in minutes or hours. From there, you can express it as a percentage by dividing total downtime by planned production time and multiplying by 100. This calculation applies to any piece of equipment, production line, or entire facility, and it forms the foundation for nearly every operational performance metric manufacturers rely on. The sections below cover the formulas, related metrics, cost calculations, root causes, and practical reduction strategies.
What counts as downtime in manufacturing?
In manufacturing, downtime is any period during which equipment or a production line is not producing output when it was scheduled to do so. It falls into two broad categories: planned downtime, which includes scheduled maintenance, changeovers, and planned shutdowns, and unplanned downtime, which covers unexpected failures, breakdowns, and emergency stops. Both reduce available production time, but unplanned downtime is typically far more costly because it cannot be planned for.
Understanding what counts as downtime matters because inconsistent definitions lead to inconsistent data. Many plants only track major breakdowns, missing smaller stops that collectively represent a significant share of lost production. A complete downtime definition typically includes:
- Equipment failures and breakdowns — mechanical, electrical, or process-related
- Unplanned maintenance interventions — reactive repairs triggered by failure
- Planned maintenance windows — scheduled inspections, lubrication, part replacement
- Changeovers and setups — time spent switching between products or configurations
- Waiting time — waiting for materials, operators, or instructions
- Quality-related stops — halting production to address defects or adjust settings
Some manufacturers distinguish between availability losses (equipment not running at all) and performance losses (equipment running below rated speed). For downtime calculations specifically, the focus is on availability losses, where production has stopped entirely. Minor slowdowns are tracked separately under performance metrics.
What is the formula for calculating downtime?
The manufacturing downtime formula is straightforward: Downtime = Planned Production Time minus Actual Production Time. To express it as a percentage, use: Downtime % = (Downtime / Planned Production Time) x 100. For example, if a machine is scheduled to run for 480 minutes in a shift but only produces for 390 minutes, total downtime is 90 minutes, or 18.75% of the planned production window.
Planned production time is the starting point, not total calendar time. It excludes periods when production was never intended to run, such as weekends, holidays, or officially scheduled breaks. This distinction keeps the calculation meaningful. If you measure against total clock time, idle periods inflate the downtime figure and distort comparisons between shifts or facilities.
For individual pieces of equipment, the same formula applies at the asset level. Maintenance teams often track downtime per machine, per shift, and per failure event. This granularity helps identify which assets are responsible for the greatest share of lost production time, which is the first step toward targeted improvement.
When tracking multiple downtime events across a period, sum all individual downtime durations before applying the formula. If a line stopped three times during a shift for 15, 25, and 50 minutes respectively, total downtime for that shift is 90 minutes, which then feeds into the percentage calculation.
How does downtime connect to OEE, MTTR, and MTBF?
Downtime is a direct input into three of the most important equipment performance metrics in manufacturing: OEE (Overall Equipment Effectiveness), MTTR (Mean Time To Repair), and MTBF (Mean Time Between Failures). OEE uses downtime to calculate the Availability component, while MTTR and MTBF use individual downtime events to measure repair speed and failure frequency respectively. Together, these metrics turn raw downtime data into actionable operational intelligence.
OEE and the Availability component
OEE measures manufacturing performance across three dimensions: Availability, Performance, and Quality. The Availability score is calculated directly from downtime data: Availability = Actual Production Time / Planned Production Time. A facility running 390 of 480 planned minutes has an Availability of 81.25%. This figure is then multiplied by Performance and Quality scores to produce the overall OEE percentage. World-class OEE is generally considered to be around 85%, meaning even modest reductions in downtime produce measurable OEE improvements.
MTTR and MTBF as downtime diagnostics
MTTR measures how quickly the maintenance team restores equipment after a failure: MTTR = Total Downtime / Number of Failures. A lower MTTR means faster recovery. MTBF measures how reliably equipment runs between failures: MTBF = Total Uptime / Number of Failures. A higher MTBF means longer, more stable production runs. Used together, MTTR tells you how efficient your response is, while MTBF tells you how often you need to respond. Both are calculated from the same downtime event logs, so accurate downtime recording underpins all three metrics.
How do you calculate the cost of manufacturing downtime?
The cost of manufacturing downtime is calculated by multiplying the downtime duration by the hourly cost of lost production. A basic formula is: Downtime Cost = Downtime Hours x Hourly Production Value. However, a complete calculation must also account for labor costs during idle time, overtime to recover lost output, material waste, contractual penalties, and the cost of emergency maintenance. The true cost is almost always significantly higher than the lost production value alone.
To build a realistic downtime cost model, consider each cost category separately:
- Lost production revenue — the output that was not produced multiplied by its margin or selling price
- Labor costs — wages paid to operators and maintenance staff during the downtime period
- Overtime costs — premium pay to recover lost production after the event
- Maintenance and repair costs — parts, contractor fees, emergency call-outs
- Scrap and waste — materials lost during the failure or restart process
- Contractual penalties — late delivery fees or service level agreement breaches
- Secondary equipment damage — wear or damage caused to connected components during a failure event
Industry experience consistently shows that the visible costs of a breakdown, the repair bill and the obvious lost output, represent only a fraction of the total impact. The indirect costs, including logistics disruption, customer relationship damage, and the administrative burden of emergency procurement, often exceed the direct costs. This is why total cost of ownership analysis is a more reliable framework than simply tracking repair spend when evaluating the real impact of equipment downtime.
What causes the most unplanned downtime in manufacturing?
The most common causes of unplanned downtime in manufacturing are mechanical failures in rotating equipment, misalignment of drive components, bearing and seal failures, and inadequate or reactive maintenance practices. Rotating machinery, including pumps, fans, compressors, and conveyors, sits at the center of most industrial processes, and failures in these assets propagate quickly through production systems.
Misalignment in rotating equipment is a particularly significant driver. Industry sources consistently identify misalignment as responsible for a substantial share of rotating machinery failures because misaligned shafts impose continuous side loads on bearings and seals that accelerate wear far beyond design expectations. This leads to failures that appear sudden but have been building for weeks or months through gradual component degradation.
Other frequent contributors to unplanned downtime include:
- Wear in mechanical couplings — elastomers, gear teeth, and friction elements degrade over time and require periodic replacement
- Vibration-induced fatigue — excessive vibration accelerates wear across the entire drivetrain
- Inadequate lubrication — missed or incorrect lubrication of couplings and bearings
- Maintenance-induced failures — errors introduced during reassembly, alignment, or fastener torquing
- Electrical and control system faults — sensor failures, drive faults, and control logic errors
- Process upsets — overloads, cavitation, and pressure transients that stress mechanical components
The maintenance-induced failure category is often underestimated. Every time a technician works on rotating equipment, there is a probability of error: incorrect bolt torque, imperfect reassembly, or misalignment introduced during reinstallation. Reducing the frequency of required interventions directly reduces this risk.
How can manufacturers reduce downtime after calculating it?
After calculating downtime and identifying its sources, manufacturers reduce it by shifting from reactive to predictive maintenance, eliminating failure-prone components, addressing root causes rather than symptoms, and improving the reliability of drivetrain connections. The goal is to extend mean time between failures while reducing mean time to repair, both of which directly improve availability and OEE.
Effective downtime reduction strategies include:
- Root cause analysis on every significant failure — identify whether the cause was mechanical, operational, or maintenance-related before closing the work order
- Condition monitoring — vibration analysis, thermal imaging, and oil analysis detect degradation before it causes failure
- Predictive maintenance scheduling — replace components based on condition data rather than fixed intervals
- Drivetrain redesign — eliminate wear-prone components that require frequent replacement or alignment
- Standardization of spare parts — reduce lead times by holding critical spares on site
- Operator training — equip frontline staff to detect early warning signs and report them before failures escalate
One of the highest-leverage improvements available to asset-intensive manufacturers is addressing the drivetrain connection between motors and driven equipment. Traditional mechanical couplings require periodic element replacement, precision laser alignment, and regular inspection, each of which is both a maintenance cost and a failure risk. Reducing the number of required interventions structurally lowers the probability of maintenance-induced failures and extends the period between planned stops.
How Zytec helps reduce unplanned downtime in manufacturing
Zytec's non-contact magnetic drives are engineered specifically to address the root causes of unplanned downtime in rotating equipment. By eliminating physical contact between the motor and driven machine, Zytec drives remove the wear mechanisms that make conventional couplings a recurring source of failures, maintenance interventions, and lost production time.
For manufacturers who have calculated their downtime and traced it back to drivetrain-related failures, misalignment, vibration, or bearing and seal overload, Zytec's technology offers a structural solution rather than a workaround. Key performance benefits include:
- No wear components — no elastomers, gear teeth, or friction elements to replace, eliminating a major source of scheduled and unplanned stops
- No laser alignment required — the non-contact design tolerates up to 12 mm of radial misalignment, removing a critical maintenance step and the errors it introduces
- Vibration reduction up to 80% — lower vibration extends the service life of bearings, seals, and connected equipment across the drivetrain
- Energy savings up to 50% — intelligent load matching reduces overcapacity losses in pump and fan applications
- 20+ years maintenance-free operation — installations have run for over seven years without a single coupling-related intervention
- Payback period often under two years — driven by combined energy savings, maintenance cost reduction, and avoided downtime losses
If your downtime calculations point to rotating equipment as a primary driver of lost production, contact Zytec to find out how a non-contact drive can eliminate the failure modes costing your operation the most.
Frequently Asked Questions
How often should we be recording and reviewing downtime data?
Downtime should be recorded in real time or as close to it as possible — ideally at the moment each stop event begins and ends. Waiting until the end of a shift to log downtime from memory introduces inaccuracies that compound over time. For review cycles, most manufacturers benefit from daily shift-level reviews for operational decisions, weekly trend analysis for maintenance planning, and monthly deep-dives for strategic reliability improvements.
What's the best way to get started if we've never formally tracked downtime before?
Start simple: define what counts as a downtime event for your operation, assign responsibility for logging it, and use even a basic spreadsheet to capture the start time, end time, asset, and reason code for every stop. Resist the urge to build a complex system before you have baseline data. Once you have 30 to 60 days of consistent records, patterns will emerge that tell you where to focus improvement efforts and whether investing in dedicated CMMS or downtime tracking software is justified.
What are the most common mistakes manufacturers make when calculating downtime?
The most frequent mistake is measuring downtime against total calendar time rather than planned production time, which inflates the figure and makes comparisons between shifts or sites meaningless. A close second is only tracking major breakdowns while ignoring minor stops and micro-stoppages, which can collectively account for more lost production than the headline failures. Inconsistent reason coding — where the same type of failure gets logged differently by different operators or shifts — is another common issue that makes trend analysis unreliable.
How do we differentiate between a downtime problem and a performance problem on the production floor?
Downtime refers specifically to periods when equipment has stopped producing entirely — it is an availability loss. A performance problem, by contrast, is when equipment is running but producing below its rated or ideal speed, which shows up in the Performance component of OEE rather than Availability. If your OEE is low but your Availability score is acceptable, the investigation should focus on speed losses, minor stoppages, and idling rather than failure events. Separating the two prevents teams from chasing the wrong root cause.
At what downtime percentage should we be concerned enough to take action?
There is no universal threshold, but a useful benchmark is that world-class OEE of 85% implies an Availability score of roughly 90% or higher, meaning total downtime should not exceed around 10% of planned production time. If unplanned downtime alone is consistently above 5%, that is a strong signal that reactive maintenance practices need to be replaced with a more structured reliability program. The more important benchmark, however, is your own trend line — downtime that is stable or declining is manageable, while downtime that is increasing demands immediate root cause investigation.
Can downtime benchmarks be compared across different industries or facility types?
Direct cross-industry comparisons should be made cautiously, because planned production time definitions, shift patterns, and process complexity vary significantly between sectors. A continuous-process chemical plant and a discrete-parts automotive line will have very different downtime profiles even at equivalent reliability levels. More meaningful benchmarking comes from comparing similar asset types — pump reliability, for example, can be benchmarked across industries — or from tracking your own facility's performance over time against clearly defined internal targets.
How do we build a business case for investing in downtime reduction when leadership wants to see ROI?
Start by quantifying your current downtime cost using the full cost model described above — lost production value, labor, overtime, maintenance spend, scrap, and any contractual penalties. Then model the improvement scenario conservatively: if a proposed change reduces unplanned downtime by 20%, what does that translate to in recovered production hours and avoided costs? Presenting downtime as a financial figure rather than an operational metric tends to resonate far more with leadership, and even modest reductions in high-value production environments typically produce payback periods well under two years.