
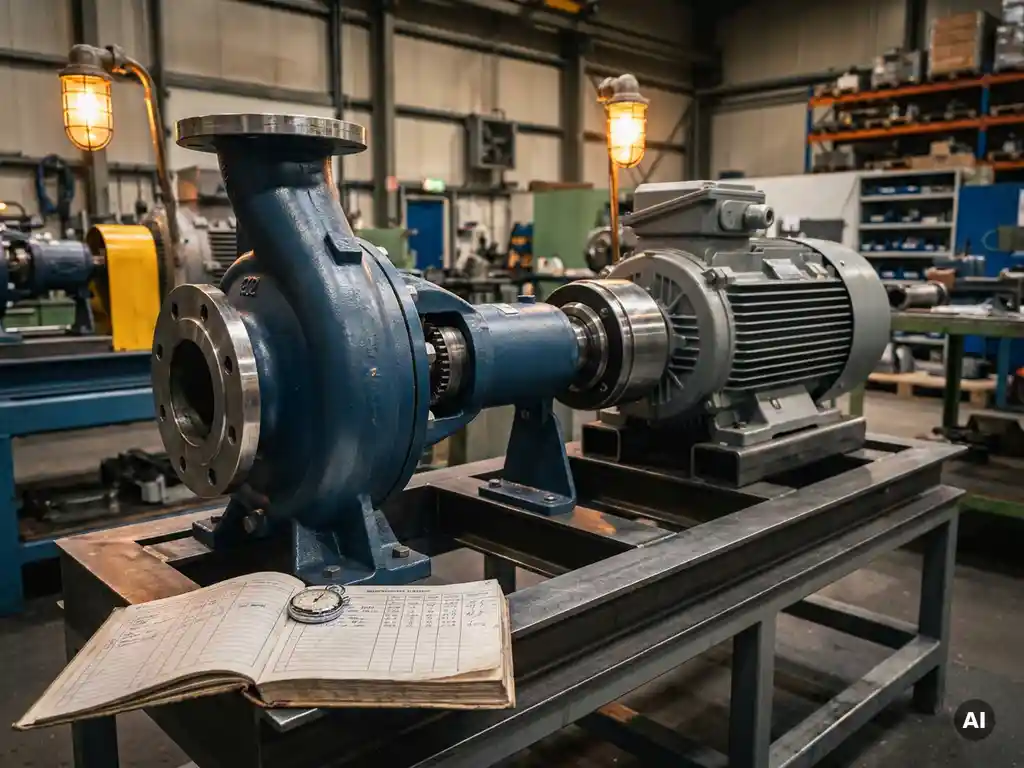
OEE, MTBF, and MTTR are three interconnected industrial performance metrics that together give operations teams a complete picture of equipment health and production efficiency. OEE (Overall Equipment Effectiveness) measures how productively a machine runs relative to its full potential, while MTBF (Mean Time Between Failures) tracks reliability and MTTR (Mean Time to Repair) measures how quickly teams recover from breakdowns. Understanding all three is essential for any industrial facility that depends on rotating equipment to maintain output and control costs.
How do OEE, MTBF, and MTTR work together?
OEE, MTBF, and MTTR work together as a linked system of cause and effect: MTBF determines how often failures interrupt production, MTTR determines how long those interruptions last, and OEE reflects the combined impact of both on overall manufacturing performance. Improving any one metric influences the others, which is why maintenance and operations teams should track all three simultaneously rather than in isolation.
Think of it this way: a facility with a high MTBF experiences fewer breakdowns, which directly lifts OEE by reducing unplanned downtime. When a failure does occur, a low MTTR means the line recovers quickly, limiting the damage to the OEE score. Together, the three metrics form a diagnostic framework that helps industrial teams identify whether their performance problems stem from equipment unreliability, slow recovery, or operational inefficiencies such as speed loss and quality defects.
For rotating equipment in particular, such as pumps, fans, compressors, and conveyors, the relationship between these metrics is especially tight. A single bearing failure can cascade into hours of downtime, driving MTTR up and OEE down. Tracking all three metrics together allows maintenance engineers and plant managers to distinguish between a reliability problem and a maintenance execution problem, and to direct improvement efforts accordingly.
How is OEE calculated in industrial operations?
OEE is calculated by multiplying three factors together: Availability, Performance, and Quality. The formula is OEE = Availability x Performance x Quality, where each factor is expressed as a percentage. A perfect OEE score of 100% means the equipment ran whenever it was scheduled, at full speed, with zero defects. In practice, world-class OEE for discrete manufacturing is generally considered to be around 85%.
Availability
Availability measures the percentage of scheduled production time during which equipment is actually running. It accounts for all unplanned and planned downtime events, including breakdowns, changeovers, and maintenance stops. The formula is: Availability = Run Time / Planned Production Time. A machine scheduled to run for eight hours but stopped for one hour due to a failure has an Availability of 87.5%.
Performance
Performance compares actual output speed to the theoretical maximum speed. It captures losses caused by slow cycles, minor stops, and equipment running below its designed capacity. The formula is: Performance = (Ideal Cycle Time x Total Count) / Run Time. A machine running at 80% of its rated speed scores 80% on Performance, regardless of whether it ran without interruption.
Quality
Quality measures the proportion of output that meets specification on the first pass. It excludes defective parts, rework, and startup waste. The formula is: Quality = Good Count / Total Count. A production run that yields 950 acceptable units from 1,000 total units scores 95% on Quality.
Multiplying the three factors together reveals how losses compound. A facility with 90% Availability, 90% Performance, and 98% Quality achieves an OEE of just under 79%, even though no single factor looks alarming on its own. This compounding effect is why OEE is a more honest measure of production effectiveness than any single metric alone.
What does MTBF tell you about equipment reliability?
MTBF, or Mean Time Between Failures, tells you the average operating time a piece of equipment runs between unplanned failures. It is calculated by dividing total uptime by the number of failures in a given period: MTBF = Total Uptime / Number of Failures. A higher MTBF means the equipment is more reliable and fails less frequently, which directly reduces unplanned downtime and supports a higher OEE Availability score.
MTBF is most useful as a trend indicator rather than an absolute number. When MTBF begins declining over successive months, it signals that equipment health is deteriorating, whether due to wear, misalignment, inadequate lubrication, or increasing load. For rotating equipment, MTBF is particularly sensitive to drivetrain condition. Misalignment is widely cited in maintenance literature as a leading cause of rotating machinery failures, introducing bearing overload, seal wear, and vibration that progressively shorten the interval between breakdowns.
MTBF also informs maintenance planning. Facilities use it to schedule preventive maintenance before failure becomes likely, to set spare parts stocking levels, and to evaluate whether equipment upgrades are justified. When comparing equipment options or coupling technologies, a solution that extends MTBF directly reduces the frequency of costly interventions and the associated production losses.
What does MTTR reveal about maintenance efficiency?
MTTR, or Mean Time to Repair, reveals how efficiently a maintenance team can diagnose, fix, and restart equipment after a failure. It is calculated by dividing total repair time by the number of repair events: MTTR = Total Repair Time / Number of Repairs. A lower MTTR means the facility recovers from failures faster, limiting the damage each breakdown inflicts on OEE and production output.
MTTR is not simply a measure of how fast technicians work. It captures the entire recovery process, including fault diagnosis, sourcing spare parts, completing lockout/tagout and permit-to-work procedures, executing the repair, realigning components where required, and verifying that the equipment is safe to restart. Each of these steps adds time, and any weak link in the chain extends MTTR significantly.
For rotating equipment, alignment-dependent repairs are a particularly significant contributor to high MTTR. Laser alignment procedures, soft-foot correction, shimming, and post-thermal-growth re-checks are time-consuming tasks that require skilled personnel and precision tools. When these steps are part of every coupling repair, MTTR rises substantially compared to installations where such procedures are not required. This is one reason why the complexity of a coupling design has a direct and measurable effect on maintenance efficiency.
What causes poor OEE, MTBF, and MTTR scores in rotating equipment?
Poor OEE, MTBF, and MTTR scores in rotating equipment are most commonly caused by mechanical wear, drivetrain misalignment, vibration, and maintenance-intensive coupling designs that require frequent intervention. These root causes are interconnected: misalignment accelerates wear, wear increases vibration, and vibration shortens the life of bearings, seals, and shafts, driving down MTBF and pushing up both MTTR and downtime losses in OEE.
The most common contributing factors include:
- Drivetrain misalignment: Both static installation misalignment and dynamic operational misalignment caused by thermal expansion, pipe strain, and foundation movement impose continuous side loads on bearings and seals, accelerating degradation and reducing MTBF.
- Wear in mechanical couplings: Elastomers, gear teeth, and friction elements in conventional couplings degrade over time, introducing torsional oscillations and shock loads that propagate into the drivetrain and shorten component life.
- Frequent maintenance interventions: Each scheduled or unplanned coupling inspection, element replacement, or realignment event contributes to MTTR and introduces the risk of maintenance-induced failures, where incorrect reassembly or imperfect alignment creates new problems.
- Unplanned downtime cascades: A single coupling failure can trigger bearing, seal, or shaft damage, turning a minor repair into a major overhaul and dramatically increasing MTTR.
- Overcapacity and inefficient speed control: Running pumps and fans at fixed speed when variable demand exists wastes energy and increases mechanical stress, shortening component life and compressing MTBF over time.
Industry experience consistently shows that misalignment and coupling-related failures account for a disproportionate share of rotating equipment maintenance spend. Addressing these root causes at the drivetrain level is therefore one of the highest-leverage interventions available to maintenance and operations teams seeking to improve all three metrics simultaneously.
How can industrial facilities improve all three metrics simultaneously?
Industrial facilities can improve OEE, MTBF, and MTTR simultaneously by targeting the root causes of drivetrain failure and maintenance complexity rather than treating each metric in isolation. The most effective strategies eliminate wear mechanisms, reduce the frequency and duration of maintenance interventions, and stabilize drivetrain loading, all of which lift MTBF, reduce MTTR, and raise OEE Availability in a single coordinated effort.
Practical steps that move all three metrics in the right direction include:
- Eliminate misalignment as a recurring failure mode: Implement coupling technologies or drivetrain designs that tolerate both static and dynamic misalignment without transmitting side loads into bearings and seals.
- Reduce scheduled maintenance touchpoints: Every coupling inspection, element replacement, or lubrication event is a potential source of maintenance-induced failure and a contributor to MTTR. Reducing the number of required interventions structurally lowers both risk and recovery time.
- Introduce soft-start capability: Eliminating inrush torque peaks at startup reduces mechanical stress on the drivetrain, extending bearing and seal life and improving MTBF.
- Implement variable speed control where appropriate: Matching pump and fan speed to actual demand reduces mechanical wear, lowers energy consumption, and extends component life without the parasitic losses associated with full variable frequency drive installations.
- Standardize spare parts and repair procedures: Simplifying the repair process reduces diagnostic time and minimizes the risk of error during reassembly, both of which directly reduce MTTR.
- Monitor drivetrain condition continuously: Tracking air gap changes, vibration trends, and bearing temperature provides early warning of developing faults, allowing planned interventions that are faster and less disruptive than emergency repairs.
The compounding effect works in both directions: just as poor MTBF and high MTTR drag OEE down, sustained improvements in drivetrain reliability and maintenance efficiency produce outsized gains in overall equipment effectiveness over time.
How Zytec Non-Contact Drives improve OEE, MTBF, and MTTR
Zytec's non-contact magnetic drives are engineered to address the root causes that degrade all three metrics at once. Because they transmit torque across an air gap using permanent magnets rather than mechanical contact, they eliminate the wear mechanisms, misalignment sensitivity, and maintenance requirements that drive down MTBF and push MTTR up.
Concrete performance impacts include:
- MTBF extension: With no elastomers, no lubrication, no gear teeth, and no friction elements, Zytec drives contain no wear components. The coupling's torque transmission does not degrade with age or accumulated operating hours, and dynamic misalignment during operation introduces no forces into bearings or seals. This extends the PF curve (the window between detectable degradation and functional failure) by approximately four times compared to conventional contact couplings, directly raising MTBF across the entire drivetrain.
- MTTR reduction: Zytec drives require no laser alignment during installation or after maintenance, no scheduled coupling element replacement, and no lubrication servicing. Eliminating these steps removes the most time-consuming and error-prone elements of rotating equipment repair, reducing MTTR significantly on every intervention.
- OEE improvement: Fewer unplanned failures mean higher Availability. Soft-start capability reduces startup stress. And in variable-speed applications, the V-TORQ drive enables speed matching to process demand without a variable frequency drive, eliminating the parasitic losses and electronic aging risks associated with VFD installations while delivering energy savings of up to 50%.
- Maintenance-free operation: Zytec drives are designed for a maintenance-free operational span of more than 20 years, with no scheduled coupling inspections required beyond monitoring air gap changes as a system-level health indicator.
If your facility is looking to move all three metrics in the right direction with a single drivetrain upgrade, contact Zytec to discuss which non-contact drive is the right fit for your application.
Frequently Asked Questions
What is a realistic OEE improvement target for a facility that currently scores below 60%?
A facility scoring below 60% OEE is typically experiencing significant losses across multiple factors, so even modest improvements in Availability through better MTBF and MTTR can produce dramatic gains. A realistic near-term target is 70–75%, achievable by focusing first on the single largest source of unplanned downtime rather than trying to improve all three OEE factors simultaneously. From there, incremental gains toward the world-class 85% benchmark become more manageable as reliability and maintenance processes stabilize.
How often should we recalculate MTBF and MTTR to get meaningful trend data?
Monthly recalculation is the most practical cadence for most industrial facilities, as it provides enough data points to identify trends without being so granular that individual anomalies distort the picture. For high-criticality equipment, a rolling 90-day window updated weekly gives a more responsive view of deteriorating reliability. The key is consistency: using the same time boundaries, the same definition of a failure event, and the same repair clock start and stop points every time you calculate, so that month-over-month comparisons are genuinely meaningful.
Can we improve MTTR without investing in new equipment or coupling technology?
Yes, significant MTTR reductions are achievable through process and organizational improvements alone. Standardizing repair procedures into step-by-step work instructions, pre-staging critical spare parts at point-of-use rather than in a central storeroom, and ensuring technicians are trained and certified on precision alignment tools can collectively cut repair time by 20–40% before any hardware change is made. That said, if alignment-dependent repairs are a recurring bottleneck, the structural MTTR reduction that comes from eliminating those steps through drivetrain redesign will outperform procedural improvements over the long term.
What is the difference between MTTR and MTBR, and does it matter for tracking these metrics?
MTTR (Mean Time to Repair) measures only the active repair time from failure detection to equipment restart, while MTBR (Mean Time Between Repairs) measures the interval between any maintenance intervention, whether planned or unplanned. For OEE purposes, MTTR is the more directly relevant metric because it quantifies the downtime impact of each failure event. However, tracking MTBR alongside MTTR is valuable for understanding the total maintenance burden on a piece of equipment, including scheduled work that may not cause failures but still consumes technician time and contributes to maintenance-induced risk.
How do we decide which piece of equipment to prioritize when trying to improve OEE across a whole facility?
Start by identifying the equipment with the lowest individual OEE score that sits on your critical production path, meaning a failure stops the entire line rather than just one work cell. A Pareto analysis of unplanned downtime events over the past 12 months will typically reveal that 20% of your equipment accounts for 80% of your total downtime losses, giving you a clear prioritization list. Focus improvement efforts there first, since gains on bottleneck equipment translate directly into facility-level OEE improvement, whereas optimizing non-bottleneck assets often produces no measurable throughput benefit.
Is it possible to have a high MTBF but still suffer from poor OEE? What would cause that?
Absolutely, and it is more common than many operations teams expect. A machine that rarely breaks down can still score poorly on OEE if it runs consistently below its rated speed (a Performance loss) or produces a high proportion of out-of-spec output (a Quality loss). For example, a pump running at 70% of its design flow rate due to impeller wear will show a strong MTBF if it never fully fails, but its Performance factor will drag OEE well below benchmark. This is precisely why OEE's three-factor structure is more diagnostic than any single reliability metric.
What role does condition monitoring play in improving all three metrics, and where is the best place to start?
Condition monitoring improves all three metrics by converting unplanned failures into planned interventions: it extends effective MTBF by catching faults before they cause a full breakdown, reduces MTTR because technicians arrive prepared with the right parts and a clear diagnosis, and lifts OEE Availability by eliminating the surprise downtime events that are hardest to recover from quickly. The best starting point for most facilities is vibration monitoring on the highest-criticality rotating equipment, since vibration signatures provide early and reliable warning of bearing wear, misalignment, and imbalance, which are the dominant failure modes in pumps, fans, and compressors.