
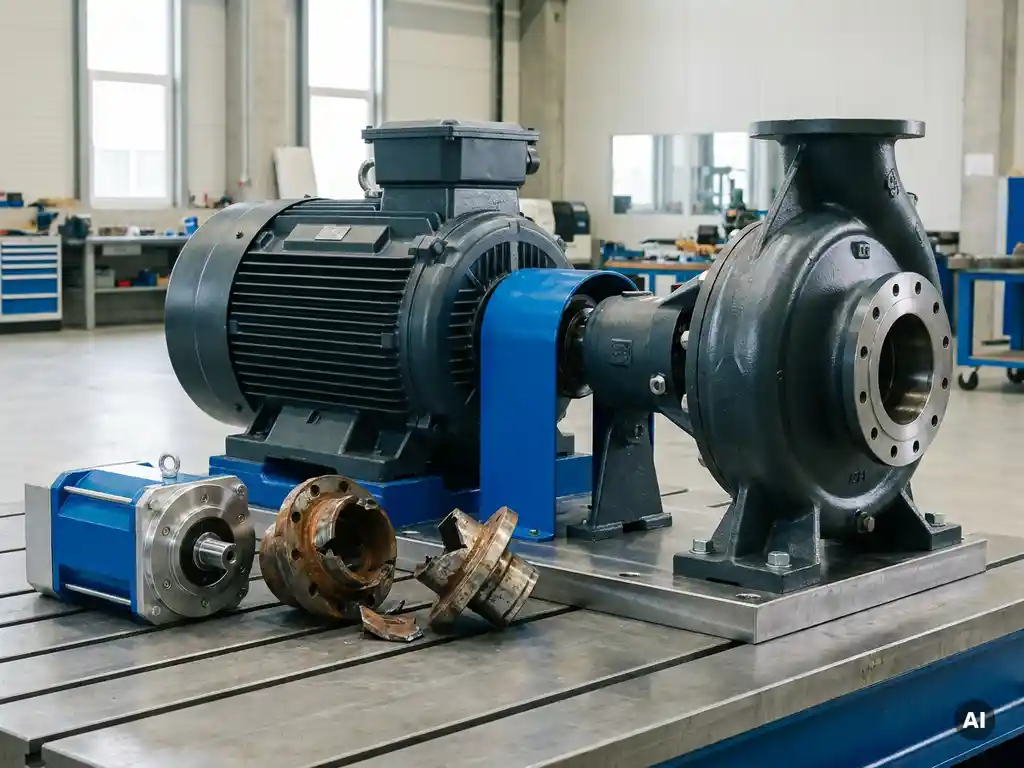
MTTR and MTBF are two of the most important reliability metrics used in industrial maintenance. MTBF (Mean Time Between Failures) measures how long equipment runs on average between breakdowns, while MTTR (Mean Time To Repair) measures how long it takes to restore that equipment to working condition after a failure. Together, they give maintenance teams a clear picture of both equipment reliability and operational responsiveness. This article unpacks each metric in detail, explains how to calculate and interpret them, and explores what drives poor performance in rotating equipment applications.
What is the difference between MTTR and MTBF?
MTBF and MTTR measure opposite sides of the reliability equation. MTBF (Mean Time Between Failures) quantifies how reliable equipment is by measuring the average operating time between failures. MTTR (Mean Time To Repair) quantifies how efficient your maintenance response is by measuring the average time needed to diagnose, fix, and return equipment to service after a failure occurs.
Think of MTBF as a measure of how often things go wrong, and MTTR as a measure of how quickly you recover when they do. A high MTBF means equipment runs for long periods without breaking down. A low MTTR means your team restores it quickly when it does. Both metrics matter independently, but their relationship determines your actual production availability.
In practical terms, a plant can have excellent MTBF but still suffer significant downtime if its MTTR is high. Conversely, a fast-responding maintenance team can partially compensate for unreliable equipment, but only up to a point. The goal in any asset-intensive operation is to drive MTBF up and MTTR down simultaneously.
How is MTBF calculated for rotating equipment?
MTBF is calculated by dividing the total operating time of a piece of equipment by the number of failures that occurred during that period. The formula is: MTBF = Total Operating Time / Number of Failures. For example, if a pump runs for 8,000 hours and experiences four failures in that period, its MTBF is 2,000 hours.
For rotating equipment such as pumps, fans, compressors, and conveyors, the calculation should only count unplanned failures, not scheduled maintenance stops. Planned shutdowns are excluded because they do not reflect equipment reliability. The operating time used in the calculation is the actual run time, not calendar time, which makes accurate logging of start and stop events essential.
In practice, MTBF for rotating equipment is tracked per asset or per asset class. A fleet of centrifugal pumps across a facility might be analyzed together to identify whether a low MTBF is specific to one unit or systemic across the installation. Tracking MTBF over time also reveals trends: a declining MTBF often signals aging components, deteriorating operating conditions, or recurring misalignment issues that are not being fully resolved between repairs.
It is worth noting that MTBF is a statistical measure and works best when calculated across a meaningful number of failure events. A single failure on a relatively new machine does not produce a reliable MTBF figure. The metric becomes more meaningful as data accumulates over time or across multiple identical assets.
How is MTTR calculated and what does it include?
MTTR is calculated by dividing the total time spent on repairs by the number of repair events during the same period. The formula is: MTTR = Total Repair Time / Number of Repairs. If a maintenance team spends a combined 40 hours repairing a fan system across five breakdown events, the MTTR for that asset is 8 hours per failure.
What counts as "repair time" is a common source of confusion. A comprehensive MTTR calculation should include every hour from the moment a failure is detected to the moment the equipment is confirmed to be back in normal operation. This means MTTR captures more than just the hands-on wrench time. It includes:
- Fault detection and notification time
- Diagnostic and troubleshooting time
- Waiting time for spare parts or specialist contractors
- Permit-to-work and lockout/tagout administration
- Physical disassembly, repair, and reassembly
- Alignment and commissioning procedures
- Functional testing and sign-off before return to service
In rotating equipment maintenance, the alignment step alone can add several hours to a repair event. Laser alignment requires setup, measurement, correction, and re-verification after thermal stabilization. Administrative steps such as permit-to-work documentation are often underestimated but can account for a significant portion of total repair time, particularly in regulated industries such as oil and gas, chemical processing, and water treatment.
What is a good MTBF and MTTR value in industrial settings?
There is no universal benchmark for a "good" MTBF or MTTR because acceptable values depend heavily on the industry, the criticality of the asset, and the consequences of failure. However, in most industrial settings, a higher MTBF is always better, and a lower MTTR is always better. The target is set relative to what your process can tolerate and what your competitors or industry peers achieve.
For critical rotating equipment in continuous process industries such as chemical plants, refineries, or water utilities, MTBF targets are often measured in years rather than months. Assets operating in these environments are expected to run reliably between planned maintenance intervals, which may be set at 12, 24, or even 36 months. An MTBF significantly below the planned maintenance interval is a strong signal that the asset or its operating conditions require attention.
For MTTR, most industrial operations aim for values measured in hours rather than days. Best-in-class maintenance organizations for rotating equipment often target an MTTR of four to eight hours for standard assets, though this depends on asset complexity and parts availability. For simple equipment with readily available spares, an MTTR exceeding 24 hours typically indicates a process problem, not a technical one.
The most useful approach is to establish your own baseline, then track improvement over time. Benchmarking against industry peers can provide directional guidance, but internal trend data is the most actionable indicator of whether your reliability and maintenance practices are moving in the right direction.
How do MTTR and MTBF relate to overall equipment effectiveness?
MTBF and MTTR are direct inputs into availability, which is one of the three components of Overall Equipment Effectiveness (OEE). Availability is calculated as: Availability = MTBF / (MTBF + MTTR). This means that improving either metric improves availability, and availability directly influences OEE alongside performance rate and quality rate.
OEE is a widely used production KPI that captures how effectively a manufacturing or process asset is being used relative to its full potential. A facility running at 85% OEE is considered world-class in many industries. Availability losses, driven by unplanned downtime, are frequently the largest single drag on OEE scores in asset-intensive operations.
The relationship between these metrics makes the business case for reliability investment straightforward. Doubling MTBF while halving MTTR can dramatically shift availability. For example, an asset with an MTBF of 500 hours and an MTTR of 10 hours runs at approximately 98% availability. If poor practices push MTBF down to 200 hours with the same MTTR, availability drops to around 95%. In a continuous process running 8,000 hours per year, that difference represents hundreds of additional hours of lost production annually.
Maintenance KPIs such as MTBF and MTTR should therefore be reviewed alongside OEE data rather than in isolation. When OEE drops, availability data points directly to whether the cause is more frequent failures, slower repairs, or both.
What causes poor MTBF and high MTTR in pump and fan applications?
In pump and fan applications, poor MTBF is most commonly caused by mechanical stress from misalignment, vibration, and wear in the drivetrain. High MTTR is most commonly caused by the complexity of repair procedures, particularly the time required for alignment, permit administration, and parts sourcing. Both problems often share a common root cause: conventional mechanical coupling technology.
Misalignment is widely cited in reliability literature as responsible for a substantial share of rotating machinery failures. Even when equipment is precisely aligned during installation, thermal expansion, pipe strain, foundation movement, and seasonal temperature variation cause dynamic misalignment during operation. This misalignment generates cyclic forces that accelerate bearing and seal wear, shorten component life, and produce the vibration signatures that precede failure. The result is a shorter time between failures and a higher frequency of maintenance interventions.
High MTTR in these applications is compounded by the repair process itself. Each maintenance event on a pump or fan typically requires lockout/tagout and permit-to-work administration, disassembly of the coupling and surrounding components, inspection and replacement of wear elements, precision laser alignment, and a staged recommissioning process. Each of these steps carries a risk of human error, and errors during reassembly or alignment can trigger another failure shortly after return to service, further degrading MTBF.
Vibration-related failures also tend to cascade. When a coupling degrades, the resulting vibration loads accelerate wear in adjacent bearings, seals, and shafts. This means a single root cause can produce multiple sequential failure events, each with its own MTTR, compressing the apparent MTBF of the entire drivetrain.
How Zytec Non-Contact Drives Improve MTBF and Reduce MTTR
Zytec's non-contact magnetic drives are engineered to address the root causes of poor MTBF and high MTTR in rotating equipment. Because they transmit torque across an air gap using permanent magnets rather than mechanical contact, the failure mechanisms that dominate conventional drivetrain maintenance are eliminated by design. The practical impact on reliability metrics is significant:
- No wear components: Zytec drives contain no elastomers, no lubrication systems, no gear teeth, and no friction elements. Torque transmission characteristics do not degrade with operating hours, extending the time between failures substantially.
- No alignment requirement: Installation tolerates up to 12 mm of radial misalignment without laser alignment. Dynamic misalignment during operation does not generate forces into bearings or seals, removing the primary driver of bearing and seal failures.
- Vibration reduction up to 80%: By isolating torsional shock and dampening vibration across the drivetrain, Zytec drives extend the service life of all downstream components, directly improving MTBF across the entire installation.
- Maintenance-free coupling operation for 20+ years: Scheduled coupling element replacement and periodic re-alignment are eliminated, removing the maintenance interventions that contribute to high MTTR and introduce human error risk.
- Faster recovery when maintenance is needed: With no precision alignment required and no wear consumables to source, repair events are shorter and simpler, reducing MTTR for the overall system.
For industrial operations where pump and fan reliability is mission-critical, Zytec's technology offers a measurable path to better maintenance KPIs and lower total cost of ownership. Contact Zytec to discuss how non-contact drive technology can be applied to your specific rotating equipment challenges.
Frequently Asked Questions
How many failure events do I need before my MTBF data becomes statistically reliable?
As a general rule of thumb, you need at least five to ten failure events on a given asset or asset class before MTBF figures become statistically meaningful. With fewer data points, a single unusually long or short run time can skew the average significantly. If you have limited failure history on a specific machine, consider pooling data across identical or similar assets in your facility to build a more representative baseline faster. As data accumulates over time, your confidence in the MTBF figure increases and trend analysis becomes far more actionable.
What is the fastest way to reduce MTTR without investing in new equipment?
The quickest wins in MTTR reduction typically come from eliminating non-wrench time rather than speeding up the physical repair itself. Start by auditing where time is actually lost during a typical repair event: common culprits include waiting for spare parts, delays in permit-to-work approvals, and time spent locating tools or documentation. Maintaining a dedicated critical spares inventory for high-frequency failure components, pre-staging repair kits, and standardizing step-by-step repair procedures can realistically cut MTTR by 30–50% before any capital investment is made. Digital work order systems that capture real-time repair timestamps also help identify the specific bottlenecks unique to your operation.
Should I track MTBF and MTTR per individual asset or across an entire asset class?
Both levels of analysis serve different purposes and ideally should be tracked together. Asset-level tracking helps you identify specific underperforming units that may have installation issues, operating condition problems, or a history of poor-quality repairs. Asset-class tracking — for example, all centrifugal pumps of the same model across a facility — helps distinguish whether a problem is systemic or isolated to a single machine. If one pump in a fleet of ten has an MTBF three times lower than the others, that is an asset-specific investigation; if all ten are trending downward simultaneously, the root cause is likely a shared factor such as fluid quality, operating conditions, or a common component supplier.
Can improving MTBF and MTTR actually be quantified in financial terms?
Yes, and this calculation is often the most persuasive tool for securing maintenance investment approvals. Start by establishing your cost of unplanned downtime per hour — this should include lost production, labor, expedited parts, and any contractual penalties. Then use the availability formula (MTBF / (MTBF + MTTR)) to calculate how many additional production hours a targeted improvement in either metric would recover annually. For a continuous process plant running 8,000 hours per year, even a 1% improvement in availability can represent tens to hundreds of thousands of dollars in recovered output, making the financial case for reliability investment straightforward to build.
What is the difference between MTTR and MTBR, and should I be tracking both?
MTBR (Mean Time Between Repairs) is a closely related but distinct metric that measures the average time between any maintenance intervention — including planned maintenance — rather than only unplanned failures. While MTBF focuses purely on reliability by counting only breakdowns, MTBR gives a fuller picture of total maintenance burden by capturing both reactive and preventive work. For rotating equipment, tracking both is valuable: a declining MTBR alongside a stable MTBF, for instance, may indicate that your preventive maintenance frequency is increasing without a corresponding reliability benefit, signaling over-maintenance or poorly calibrated PM intervals.
How does predictive maintenance technology affect MTBF and MTTR in practice?
Predictive maintenance (PdM) technologies such as vibration analysis, thermography, and oil analysis primarily impact MTBF by detecting developing faults before they become failures, allowing intervention before a breakdown occurs. When implemented effectively, PdM can significantly extend MTBF by catching issues like bearing wear, misalignment, and imbalance in their early stages. The effect on MTTR is more nuanced: while PdM can reduce MTTR by allowing maintenance teams to pre-plan repairs and pre-stage parts before a failure occurs, it does not eliminate the time required for the repair itself. The greatest reliability gains come when PdM is combined with drivetrain technologies that reduce the underlying failure rate rather than simply detecting failures earlier.
What common mistakes do maintenance teams make when first implementing MTBF and MTTR tracking?
The most common mistake is inconsistent data capture — specifically, failing to log the exact start and end times of both failure events and repair activities, which makes the resulting metrics unreliable. A second frequent error is including planned maintenance shutdowns in MTBF calculations, which artificially deflates the figure and misrepresents true equipment reliability. Teams also commonly track MTTR using only hands-on repair time rather than total elapsed time from failure detection to return to service, which masks the real drivers of downtime such as parts delays and administrative processes. Establishing clear, standardized definitions for what constitutes a failure event and what counts as repair time — and training all technicians to log data consistently — is the essential first step before any meaningful analysis can begin.