
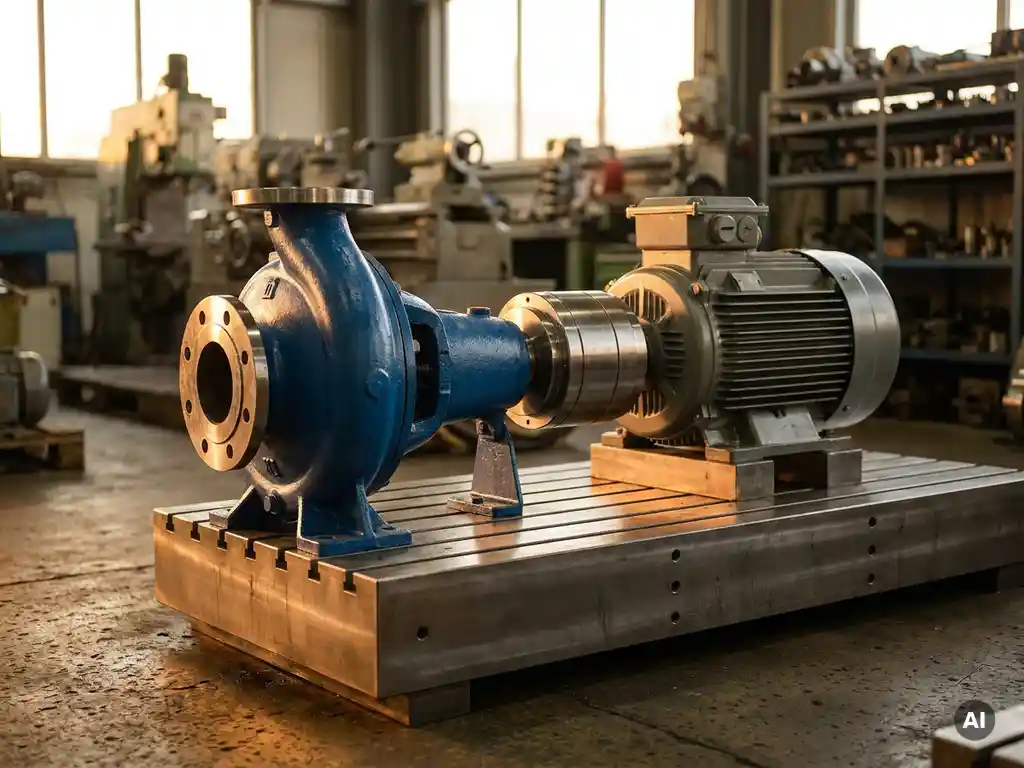
What are the three components of OEE?
The three components of overall equipment effectiveness are Availability, Performance, and Quality. Each one measures a distinct dimension of equipment productivity, and together they give operations teams a comprehensive picture of where production losses are actually occurring. No single component tells the full story on its own.
Availability
Availability measures the proportion of planned production time during which equipment is actually running. It accounts for all events that stop production when the machine was scheduled to operate, including breakdowns, changeovers, and unplanned stoppages. A machine that runs for 400 minutes out of a planned 480-minute shift has an availability of 83%.
Performance
Performance measures how fast equipment runs compared to its designed or ideal cycle time. Even when a machine is running, it may be cycling slower than its rated speed due to minor stoppages, operator hesitation, or worn components. A line producing 800 units per hour against an ideal rate of 1,000 units per hour has a performance rate of 80%.
Quality
Quality measures the proportion of output that meets specification on the first pass, without rework or scrap. It captures losses caused by defects, startup rejects, and process instability. A batch where 950 out of 1,000 units pass inspection has a quality rate of 95%.
These three dimensions are not interchangeable. A plant can have excellent availability but poor performance, or near-perfect quality with chronic downtime. Tracking all three separately is what makes OEE a genuinely diagnostic metric rather than a simple productivity number.
What is the OEE formula and how does it work?
The OEE formula is: OEE = Availability × Performance × Quality. Each factor is expressed as a decimal between 0 and 1, and the result is multiplied together to produce an overall percentage. For example, an availability of 0.83, a performance rate of 0.80, and a quality rate of 0.95 gives an OEE of 0.83 × 0.80 × 0.95 = 63.1%.
What makes this formula powerful is its compounding effect. Losses in each category multiply against each other, which means even moderate underperformance across all three dimensions can produce a surprisingly low overall score. A plant with 90% availability, 90% performance, and 90% quality still only achieves an OEE of 72.9%. This compounding nature is precisely why OEE is such a demanding benchmark and why sustained improvement across all three pillars is necessary to reach world-class levels.
To calculate each component correctly, you need reliable time data. Planned production time is your starting point, which is the total shift time minus scheduled breaks and planned maintenance. From there:
- Availability = (Planned Production Time minus Downtime) divided by Planned Production Time
- Performance = (Actual Output divided by Maximum Possible Output) at ideal cycle time
- Quality = Good Units Produced divided by Total Units Produced
Accurate data collection is the foundation of a meaningful OEE calculation. Many plants discover that their biggest challenge is not improving performance but accurately measuring it in the first place.
What is a good OEE score for industrial equipment?
A good OEE score for industrial equipment is generally considered to be 85% or above, which is widely cited as the world-class benchmark for discrete manufacturers. A score of 65% is typical for many industrial operations and represents a realistic baseline for plants that have not yet focused on systematic OEE improvement. Scores below 65% indicate significant room for improvement.
These benchmarks should be interpreted in context. The 85% world-class figure assumes availability of around 90%, performance of around 95%, and quality of around 99.9%. In practice, very few plants sustain all three at these levels simultaneously, which is why 85% remains an aspirational target rather than a common baseline.
Industry type also matters considerably. Process industries such as chemical production, oil refining, and pulp and paper manufacturing often have different OEE profiles than discrete manufacturers. Continuous processes may have lower planned downtime but face more severe consequences when unplanned stops occur. Benchmarking OEE against direct industry peers is more meaningful than comparing against a universal standard.
It is also worth noting that a very high OEE score is not always the right objective. A plant running at 95% OEE with no buffer capacity may struggle to absorb demand spikes or recover quickly from failures. OEE improvement should always be considered alongside broader capacity planning and maintenance strategy.
What are the six big losses that reduce OEE?
The six big losses are the six categories of productivity loss that OEE is specifically designed to measure and expose. They map directly onto the three OEE components: two losses reduce Availability, two reduce Performance, and two reduce Quality. Identifying which of the six big losses is dominant in a given operation tells maintenance and operations teams exactly where to focus improvement efforts.
Losses that reduce Availability
- Equipment failures and breakdowns: Unplanned stops caused by mechanical failure, electrical faults, or component wear. These are typically the most visible and most costly availability losses.
- Setup and adjustment time: Time lost during changeovers, product transitions, tooling changes, or warm-up periods after planned maintenance. Reducing setup time is a core focus of lean manufacturing methods such as SMED (Single Minute Exchange of Die).
Losses that reduce Performance
- Idling and minor stoppages: Short interruptions of less than a few minutes that do not get logged as formal downtime but accumulate significantly over a shift. Jams, sensor trips, and material feed issues fall into this category.
- Reduced speed: Equipment running below its designed cycle time or ideal production rate, often due to operator caution, worn components, or process instability.
Losses that reduce Quality
- Process defects: Scrap and rework produced during stable production runs, caused by process variation, material inconsistency, or machine drift.
- Startup rejects: Defective output produced during startup, after changeovers, or following maintenance interventions before the process reaches a stable operating state.
Most plants find that one or two of these six losses account for the majority of their OEE gap. Breakdown losses and reduced speed are frequently the dominant contributors in asset-intensive industries with rotating equipment.
How does unplanned downtime affect OEE calculations?
Unplanned downtime directly reduces the Availability component of OEE, which then compounds against Performance and Quality to produce a significantly lower overall score. Because OEE multiplies all three factors together, a single major breakdown event can collapse an otherwise strong weekly or monthly OEE figure. Unplanned downtime is typically the single largest driver of OEE losses in equipment-intensive operations.
The impact is also broader than the downtime event itself. When equipment fails unexpectedly, the restart period often produces startup rejects that reduce the Quality score. Operators may also run equipment more cautiously after a repair, reducing the Performance rate until confidence in the equipment is restored. This means one breakdown event can negatively affect all three OEE components simultaneously, not just Availability.
From a calculation standpoint, unplanned downtime is subtracted from planned production time to calculate run time. If a machine is planned to run for 480 minutes but suffers two unplanned stops totaling 90 minutes, its availability drops to 81.25%. If performance and quality are both at 95%, the resulting OEE is only 73.4%, well below what the performance and quality figures alone would suggest.
This is why maintenance strategy has such a direct and measurable impact on OEE. Reducing the frequency and duration of unplanned failures is the fastest route to meaningful OEE improvement in most industrial environments. Predictive and condition-based maintenance approaches, combined with drivetrain reliability improvements, address this loss category at its root cause.
How can rotating equipment upgrades improve OEE scores?
Rotating equipment upgrades improve OEE primarily by reducing unplanned downtime (Availability), eliminating speed losses caused by mechanical instability (Performance), and reducing startup defects after maintenance interventions (Quality). Since pumps, fans, compressors, and conveyors are central to most industrial production processes, their reliability directly determines the ceiling for overall equipment effectiveness across the entire plant.
The most common rotating equipment failure modes that suppress OEE include bearing failures from misalignment, seal degradation from vibration, and drivetrain wear that causes gradual speed loss. Each of these failure modes maps to a specific OEE loss category:
- Bearing and seal failures cause unplanned breakdowns, directly reducing Availability
- Misalignment-induced vibration forces operators to reduce speed or load, suppressing Performance
- Post-maintenance reinstallation variability creates process instability and startup rejects, reducing Quality
- Frequent maintenance interventions accumulate as setup and adjustment time, a second Availability loss category
Drivetrain technologies that eliminate mechanical contact between the motor and driven equipment address several of these failure modes simultaneously. By removing the physical coupling interface, vibration transmission into bearings and seals is reduced, misalignment sensitivity is eliminated, and the need for periodic coupling element replacement is removed. The result is fewer unplanned stops, more stable operating speeds, and longer intervals between maintenance interventions, each of which directly improves one or more OEE components.
How Zytec helps improve overall equipment effectiveness
Zytec's non-contact magnetic drives are engineered specifically to address the rotating equipment failure modes that suppress OEE in asset-intensive industries. By eliminating physical contact between the motor and driven equipment, Zytec's technology removes the primary sources of drivetrain-related downtime, speed loss, and maintenance-induced process disruption.
The concrete OEE benefits Zytec delivers include:
- Availability improvement: No wear components, no lubrication requirements, and no laser alignment mean unplanned breakdowns from coupling and misalignment failures are eliminated. Installations have operated maintenance-free for over seven years.
- Performance improvement: Vibration reduction of up to 80% allows equipment to run at designed speeds consistently, without operator-imposed derating caused by mechanical instability.
- Quality improvement: Fewer maintenance interventions mean fewer restart events and less process disruption, reducing the startup reject losses that suppress Quality scores.
- Energy savings: Energy consumption reductions of up to 50% directly lower the cost per unit of output, improving the economics of every OEE point gained.
- Short payback period: The total cost of ownership reduction is typically realized within two years, making the OEE improvement case straightforward to quantify for procurement and finance teams.
If your operation is losing OEE points to rotating equipment failures, misalignment-related maintenance, or chronic drivetrain instability, contact Zytec to find out how non-contact magnetic drive technology can deliver measurable, lasting improvements to your availability, performance, and quality scores.
Frequently Asked Questions
How do I get started with OEE tracking if my plant has no existing measurement system?
Start by selecting one machine or production line as a pilot, rather than trying to implement OEE tracking plant-wide from day one. Manually collect shift-level data on planned production time, actual downtime events, unit counts, and defect counts for two to four weeks to establish a baseline. Once you understand what data you need and where the gaps are, you can evaluate whether a simple spreadsheet, dedicated OEE software, or an integrated MES solution is the right fit for scaling across the facility.
What is the most common mistake plants make when calculating OEE?
The most common mistake is misdefining planned production time by excluding losses that should actually be measured. For example, some teams subtract changeover time from planned production time rather than counting it as a downtime event, which artificially inflates the Availability score and hides a real loss. OEE is only a useful diagnostic tool when all six big losses are captured honestly within the calculation, not hidden in the baseline assumptions.
Should OEE be tracked per machine, per line, or across the whole plant?
OEE is most actionable at the individual machine or workstation level, because that is where the specific loss categories can be identified and addressed. Plant-level or line-level OEE scores are useful for high-level reporting and trend monitoring, but they can mask which specific asset is driving the losses. Best practice is to track OEE at the equipment level for improvement work, and roll it up to line or plant level for management dashboards.
How often should OEE scores be reviewed and acted on?
OEE data should be reviewed at three different cadences depending on the audience and purpose. Shift-level data should be reviewed daily by operators and supervisors to catch emerging issues before they compound. Weekly reviews by production and maintenance teams should focus on loss trends and prioritizing corrective actions. Monthly reviews by plant leadership should assess whether improvement initiatives are moving the needle on the underlying OEE components.
Can OEE be improved without investing in new equipment or technology?
Yes, and in many plants the first significant OEE gains come entirely from operational and behavioral changes rather than capital investment. Standardizing changeover procedures, training operators to log minor stoppages accurately, and implementing basic 5S practices around equipment access can meaningfully improve Availability and Performance scores. However, if chronic unplanned downtime is the dominant loss driver, as it is in most asset-intensive operations, addressing the root mechanical causes through maintenance strategy or equipment upgrades will eventually be necessary to sustain gains.
What is the difference between OEE and TEEP, and when should I use each?
OEE measures equipment effectiveness during planned production time only, while Total Effective Equipment Performance (TEEP) measures effectiveness against all available calendar time, including unscheduled and idle hours. OEE is the right metric for improving how well you use the time you have already committed to production. TEEP is more useful when evaluating capacity utilization decisions, such as whether to add a shift, invest in a new asset, or consolidate production onto fewer machines.
How do I prioritize which OEE loss category to tackle first?
Use a Pareto analysis on your loss data to identify which of the six big losses accounts for the greatest total time or unit loss over a representative period, typically four to eight weeks. Focus improvement effort on the single largest loss category first, since gains there will have the most immediate impact on your overall OEE score. In most industrial environments with rotating equipment, unplanned breakdowns and reduced speed losses are the dominant contributors and therefore the highest-return starting point.