
Uptime is measured as the percentage of time equipment operates without failure during a defined period. The standard formula divides actual operating hours by total available hours, then multiplies by 100. For industrial rotating equipment, this calculation forms the foundation of every reliability and maintenance decision a plant makes.
In practice, uptime measurement goes beyond a single formula. The way a facility defines "available time," accounts for planned maintenance, and tracks failure events determines whether the resulting number is genuinely useful or misleadingly optimistic. The sections below answer the most important questions around uptime measurement, calculation, and improvement.
What factors affect uptime in industrial equipment?
Uptime in industrial equipment is affected by equipment condition, maintenance quality, alignment accuracy, operating environment, and the design of the drivetrain itself. For rotating equipment specifically, the coupling between the motor and the driven machine is one of the most influential factors, because coupling-related failures are responsible for a significant share of unplanned stops across pumps, fans, compressors, and conveyors.
The most common factors that reduce equipment uptime include:
- Mechanical wear: Elastomers, gear teeth, friction elements, and lubricated interfaces degrade over time, increasing the probability of failure between maintenance intervals.
- Misalignment: Industry sources consistently identify misalignment as responsible for a large proportion of rotating machinery failures. Thermal expansion, pipe strain, and foundation movement cause dynamic misalignment during operation that frequently exceeds what was corrected during installation.
- Vibration: Excessive vibration accelerates bearing and seal wear, shortens component life, and can trigger protective shutdowns before a failure occurs.
- Unplanned maintenance interventions: Each time technicians work on rotating equipment, there is a probability of reassembly error. Incorrect bolt torque, imperfect re-alignment, or missing fasteners introduce new failure modes.
- Environmental conditions: Dust, moisture, chemical exposure, and temperature extremes all accelerate degradation in components that rely on physical contact or lubrication.
Understanding which factors dominate in a specific installation is the starting point for any serious uptime improvement program. Plants that track failure causes systematically over time consistently find that a small number of root causes account for the majority of lost production hours.
How is uptime calculated in industrial operations?
Uptime is calculated using the formula: Uptime (%) = (Actual Operating Hours / Total Available Hours) × 100. Total available hours is typically defined as the scheduled operating period, which may be 24 hours per day, 8,760 hours per year, or a defined shift pattern. Actual operating hours are the hours within that period when the equipment was running and producing output.
The critical decision in any uptime calculation is how planned maintenance time is treated. Two common approaches exist:
- Gross uptime: Planned maintenance windows are included in total available hours, so the equipment is "down" during scheduled shutdowns. This gives a conservative, whole-picture view of how much time the asset actually runs.
- Net uptime: Planned maintenance windows are excluded from the calculation. Only unplanned stops count against uptime. This approach isolates reliability performance from maintenance scheduling decisions.
Neither approach is universally correct. The choice depends on what question the plant is trying to answer. Gross uptime is more useful for production planning. Net uptime is more useful for evaluating whether the equipment itself is reliable. Most operations benefit from tracking both figures and understanding the gap between them.
For practical tracking, the data inputs required are: total scheduled hours in the period, hours lost to unplanned failures, and hours lost to planned interventions. Maintenance management systems (CMMS) should capture stop events with timestamps and cause codes to make this calculation accurate and auditable over time.
What is the difference between uptime, availability, and OEE?
Uptime measures whether equipment is running. Availability measures whether equipment is ready to run when needed. OEE (Overall Equipment Effectiveness) measures how productively equipment runs when it is operating. These three metrics address different questions and should not be used interchangeably in industrial operations.
Uptime vs. availability
Uptime is a time-based ratio that counts operating hours against available hours. Availability, particularly as defined in reliability engineering, incorporates both the frequency of failures (measured by Mean Time Between Failures, or MTBF) and the speed of recovery (measured by Mean Time To Repair, or MTTR). A machine with high uptime may still have poor availability if it fails frequently but is repaired quickly. Conversely, equipment with a long MTTR but rare failures may show lower uptime despite being fundamentally reliable.
Availability vs. OEE
OEE is a composite metric that multiplies three factors: Availability (the percentage of scheduled time the equipment is actually running), Performance (the speed at which it runs relative to its rated capacity), and Quality (the proportion of output that meets specification). A machine running at 95% uptime but at 70% of rated speed and producing 10% scrap has an OEE of roughly 60%. OEE is the most complete picture of production effectiveness, but it requires more data inputs and is most useful in manufacturing environments where speed and quality losses are measurable.
For asset-intensive industries focused on rotating equipment, uptime and availability are typically the most actionable metrics. OEE becomes more relevant when the goal is to optimize throughput rather than simply maximize equipment run time.
What are the most common causes of unplanned downtime?
The most common causes of unplanned downtime in rotating equipment are bearing failures, seal failures, coupling failures, and vibration-related damage. These failure modes are interconnected: misalignment stresses bearings and seals, worn couplings introduce torsional oscillation, and vibration accelerates degradation across the entire drivetrain. Maintenance-induced failures, where an intervention itself introduces a new defect, are also a significant and frequently underestimated contributor.
Breaking this down by root cause category:
- Mechanical wear: Components with physical contact surfaces, including coupling elements, bearings, and seals, degrade progressively. When inspection intervals are too long or condition monitoring is absent, wear reaches the failure threshold without warning.
- Misalignment: Even after precise laser alignment at installation, thermal expansion, pipe strain, and foundation movement cause operational misalignment that continuously loads bearings and seals beyond their design conditions.
- Lubrication failure: Incorrect lubricant selection, contamination, over- or under-greasing, and missed lubrication intervals are among the most preventable causes of bearing failure in industrial plants.
- Human error during maintenance: Reliability and human factors research consistently identifies maintenance interventions as a significant contributor to equipment failures. Reassembly errors, incorrect torque values, and imperfect alignment after component replacement introduce failure modes that were not present before the intervention.
- Vibration and resonance: Unbalance, misalignment, and structural resonance generate cyclical loads that fatigue shafts, fasteners, and structural connections over time, often without triggering alarms until damage is already advanced.
Plants that categorize and track every unplanned stop by root cause consistently find that a small number of mechanisms account for the majority of downtime hours. Targeting those specific causes yields faster uptime improvement than broad reliability programs applied uniformly across all equipment.
How can uptime be improved after it has been measured?
After measuring uptime, improvement follows a structured sequence: identify the dominant failure causes from historical data, eliminate or reduce those causes through engineering or process changes, and verify the improvement through continued measurement. The most durable uptime gains come from eliminating failure mechanisms by design rather than managing them through more frequent inspection or faster repair.
Practical steps for improving equipment uptime include:
- Analyze failure history: Sort unplanned stops by cause code and calculate the total downtime hours attributable to each. Focus improvement effort on the top two or three causes, which typically account for the majority of lost hours.
- Address misalignment at the source: If misalignment-related bearing and seal failures are frequent, evaluate whether the drivetrain design allows for the operational misalignment that occurs after installation. Static alignment at installation does not eliminate dynamic misalignment during operation.
- Extend inspection intervals where safe to do so: Not all inspection intervals are based on actual failure data. Review whether scheduled maintenance frequencies are justified by the equipment's condition history, and redirect maintenance hours toward higher-risk assets.
- Reduce maintenance-induced failures: Standardize reassembly procedures, use torque-controlled tools, and implement post-intervention verification steps. Each time technicians work on rotating equipment, the risk of introducing a new defect must be managed explicitly.
- Implement condition monitoring: Vibration monitoring, temperature trending, and oil analysis extend the PF curve, giving maintenance teams time to plan interventions before failures occur. Condition-based maintenance reduces both unplanned failures and unnecessary planned interventions.
- Evaluate drivetrain component selection: The coupling, bearings, and seals specified for an application determine the baseline failure rate. Components that require no scheduled maintenance, tolerate operational misalignment, and do not introduce vibration into the drivetrain structurally reduce the frequency of stops rather than simply detecting problems earlier.
What uptime benchmarks should industrial plants target?
Industrial plants typically target uptime figures between 90% and 99%, depending on the criticality of the equipment and the industry sector. Critical rotating equipment in continuous process industries, such as primary pumps, compressors, and fans in chemical, water, or oil and gas facilities, is commonly expected to achieve 95% or higher net uptime. World-class reliability programs in these sectors often report figures above 98% for critical assets.
Benchmarks vary significantly by context:
- Continuous process industries (chemical, oil and gas, water treatment): Critical equipment targets of 97 to 99% are common, because a single unplanned stop can affect the entire production chain.
- HVAC and building services: Seasonal demand patterns mean that uptime benchmarks are often applied to the peak demand period rather than the full calendar year.
- Mining and heavy industry: Equipment operates in more demanding environments, so benchmarks are often lower in absolute terms, but the financial cost of each hour of downtime is higher.
- General manufacturing: OEE, which incorporates uptime as its availability component, is the more common benchmark metric. World-class OEE is generally cited at 85% or above.
Benchmarks are most useful when compared against a plant's own historical baseline rather than against generic industry figures. A facility moving from 88% to 94% uptime on a critical pump train has achieved a meaningful result regardless of where that figure sits relative to a published benchmark. The goal is continuous, measurable improvement driven by actual failure data from the specific installation.
How Zytec Non-Contact Drives improve equipment uptime
Once uptime has been measured and failure causes identified, the next step is eliminating those causes at their source. For rotating equipment where coupling-related failures, misalignment, and vibration are primary contributors to downtime, Zytec's non-contact magnetic drives address the problem by design rather than through more frequent maintenance.
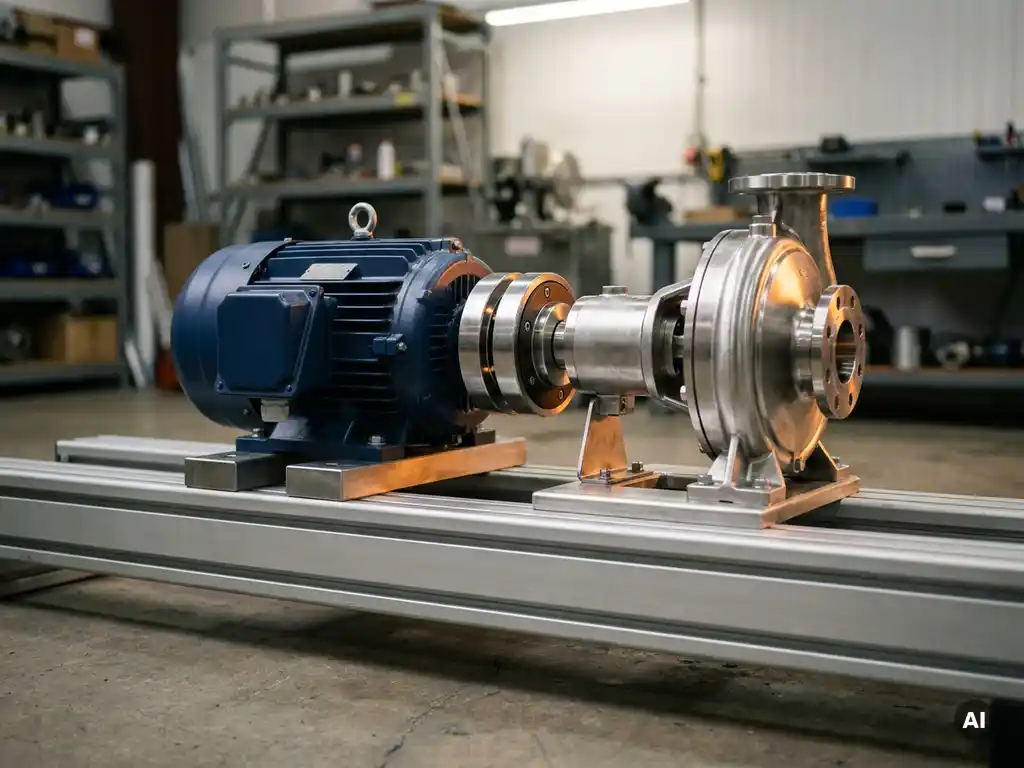
Zytec's F-TORQ Non-Contact Drive transmits torque across an air gap using powerful magnets, with no physical contact between the motor and the driven equipment. The practical uptime benefits this creates are concrete:
- No coupling wear: With no elastomers, gear teeth, or friction elements, there are no wear components to replace and no degradation in torque transmission over time. The coupling service life matches the installation lifetime.
- Misalignment tolerance by design: The non-contact principle means that operational misalignment caused by thermal expansion, pipe strain, or foundation movement generates no bearing or seal overload. The forces that cause the majority of bearing and seal failures are structurally eliminated.
- Vibration reduction up to 80%: Removing the coupling as a source of torsional oscillation and shock loads reduces vibration across the entire drivetrain, extending bearing and seal life downstream.
- No scheduled coupling maintenance: Eliminating periodic element replacement and re-alignment requirements removes the maintenance interventions that themselves introduce failure risk. Fewer planned interventions mean fewer opportunities for human error.
- Energy savings up to 50%: For applications such as pumps and fans, the A-TORQ variant provides intelligent load control that eliminates overcapacity losses, reducing both energy consumption and mechanical stress simultaneously.
The result is a structurally lower total cost of ownership, with payback periods often under two years and documented cases of installations running maintenance-free for over seven years. If your plant's uptime data points to rotating equipment as a primary driver of lost production hours, contact Zytec to discuss which non-contact drive solution fits your specific application.
Frequently Asked Questions
How do I get started with tracking uptime if my plant has no formal measurement system in place?
Start with a simple spreadsheet that logs every stop event with a timestamp, duration, and cause code — even informal categories like 'bearing failure,' 'seal leak,' or 'coupling replacement' are enough to identify patterns. Once you have three to six months of data, sort stops by total downtime hours per cause category to find your highest-impact failure modes. From there, you can build the case for a CMMS implementation and establish a reliable baseline to measure future improvements against.
What is a realistic timeframe to see measurable uptime improvement after making changes?
It depends on the failure mode being addressed and the mean time between failures of your critical equipment. If you're targeting a failure that occurs every two to three months, you may see measurable improvement within a single quarter of implementing a fix. For lower-frequency failures, a 12-month observation window is typically the minimum needed to confirm that an intervention has genuinely shifted the failure rate rather than just extended the interval by chance.
Can uptime be too high — is there such a thing as over-investing in reliability?
Yes. Pushing uptime from 95% to 99% on non-critical equipment may cost more in condition monitoring, component upgrades, and engineering time than the value of the additional run hours recovered. The right target depends on the financial consequence of each hour of downtime for that specific asset. Reliability investment should be prioritized on equipment where a failure directly stops production or creates a safety risk — not applied uniformly across the entire plant.
How does thermal expansion cause misalignment during operation even after precise laser alignment at installation?
Laser alignment is performed at ambient temperature with the equipment at rest, but during operation, motor housings, pump casings, and baseplates heat up unevenly and expand at different rates. A motor shaft that was perfectly aligned at 20°C may be several tenths of a millimeter out of alignment once the system reaches operating temperature. This dynamic misalignment continuously loads bearings and seals beyond their design conditions, which is why static alignment at installation does not fully prevent misalignment-related failures during service.
What is the difference between preventive and predictive maintenance, and which has a greater impact on uptime?
Preventive maintenance replaces or services components on a fixed schedule regardless of their actual condition, while predictive maintenance uses condition monitoring data — vibration signatures, temperature trends, oil analysis — to intervene only when a specific asset shows signs of approaching failure. Predictive maintenance generally has a greater positive impact on uptime because it eliminates both unnecessary interventions (which introduce human error risk) and unexpected failures (by catching degradation before it reaches the failure threshold). However, it requires investment in monitoring tools and the expertise to interpret the data correctly.
Are there specific industries or applications where non-contact magnetic drives are not suitable?
Non-contact magnetic drives are best suited for applications with moderate to high continuous torque requirements, such as pumps, fans, compressors, and conveyors — the equipment types where coupling-related failures most commonly drive downtime. They are generally less applicable in applications requiring precise dynamic speed control with rapid acceleration and deceleration cycles, or in environments with strong external magnetic fields that could interfere with drive performance. Consulting directly with the drive manufacturer about your specific operating conditions and duty cycle is the most reliable way to assess suitability.
How should maintenance teams handle the tension between minimizing planned downtime and ensuring equipment is properly inspected?
The key is to base inspection intervals on actual condition data rather than fixed time schedules. Equipment with a documented history of stable vibration readings and no lubrication anomalies may safely go longer between physical inspections, while assets showing trending changes in monitored parameters should be prioritized regardless of where they sit on the maintenance calendar. This risk-based approach allows maintenance hours to be concentrated on assets that genuinely need attention, reducing total planned downtime across the plant without sacrificing reliability on critical equipment.